Introduction
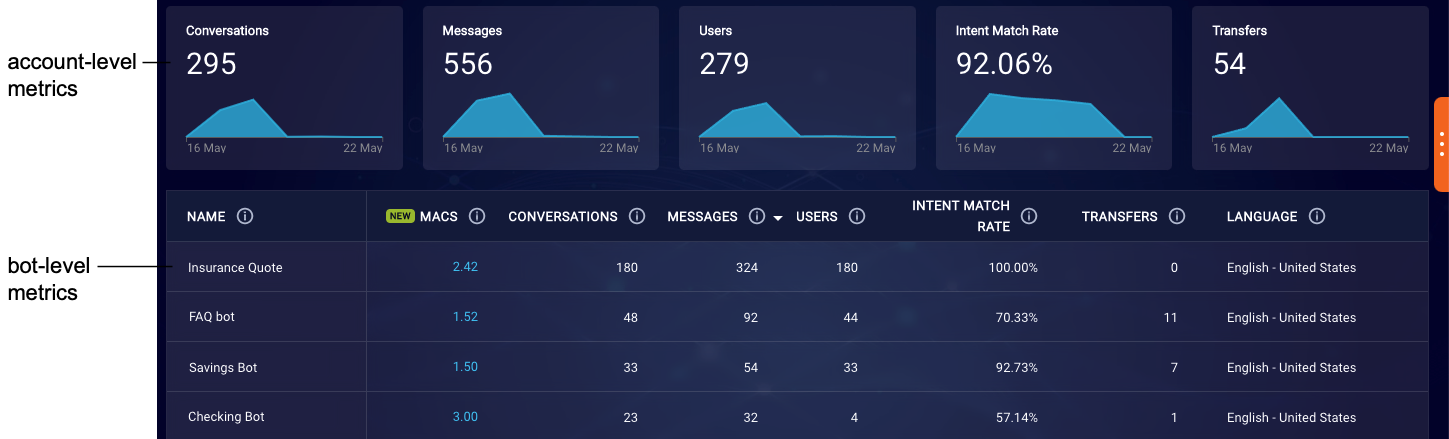
After you access Bot Analytics, the main dashboard is displayed. The dashboard is divided into two parts:
- At the top, there are account-level metrics and trend charts for all your bots regardless of environment (Demo, Production, and undeployed).
- At the bottom, there are bot-level metrics for each of the bots.
The trend charts can show data for November 1, 2020 and later.
MACS, Conversation, and Transfers metrics are specific to deployed bots and exclude conversations conducted via Conversation Builder's Preview tool. However, the rest of the metrics (Messages, Users, and Intent Match Rate) include conversations conducted via Preview. This means you can test a bot’s performance, for example, its intent matching, without having to deploy it.
Use the dashboard page to get a quick indication of the overall performance of your organization’s automation program.
Date range and time zone
On the dashboard, the date range for the displayed data is shown in the upper-right corner.
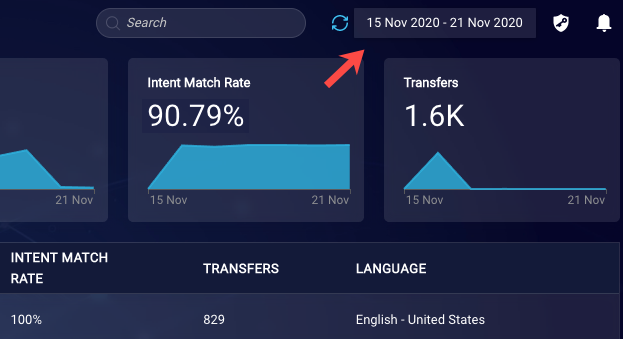
You can use this filter to show the data for any 7-day date range within the last 13 months. You can also use the date filter to change the time zone in use.
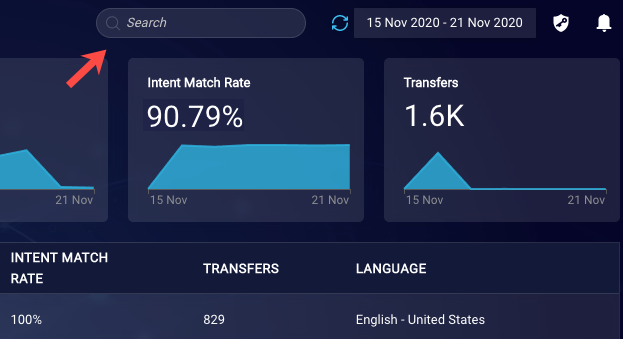
Perform a search
Use the search box in the upper-right corner to find a bot by bot name.