You must release a model version for its intents to be tracked.
Analyze intent metrics
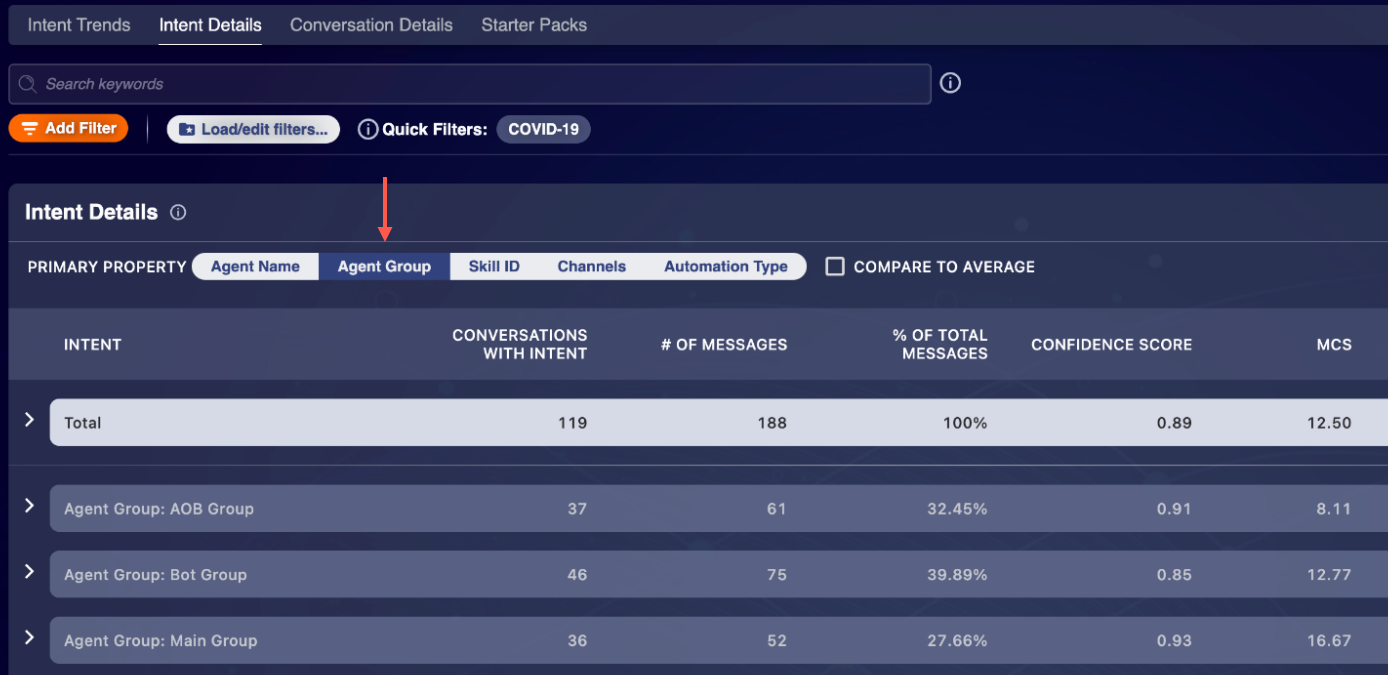
Use the Intent Details subtab under Analyze to view and evaluate intent metrics.
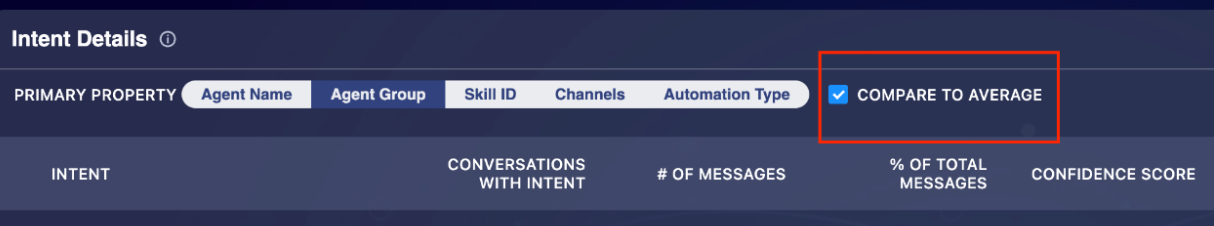
You can view intents by primary property:
- Agent Name
- Agent Group
- Skill ID
- Channels
- Automation Type
Here below is an example of grouping by agent group. We’ve selected Agent Group as the primary property.
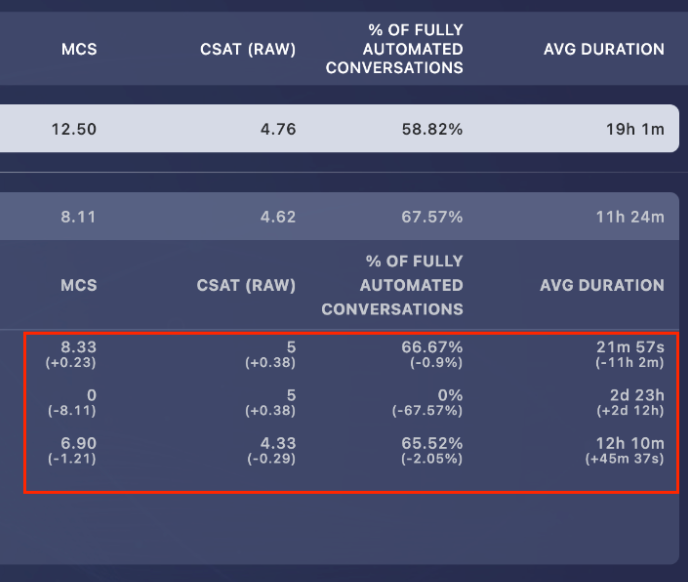
Each table is expandable. The “Total” table is the summary of all the data grouped by intent.
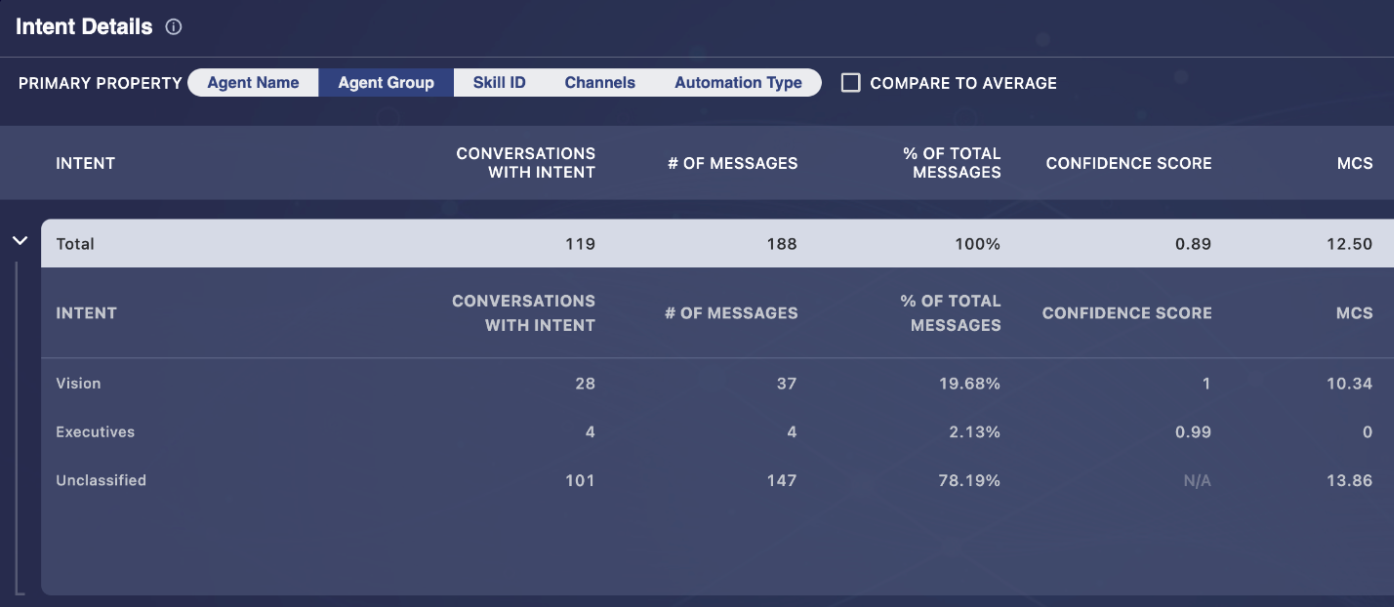
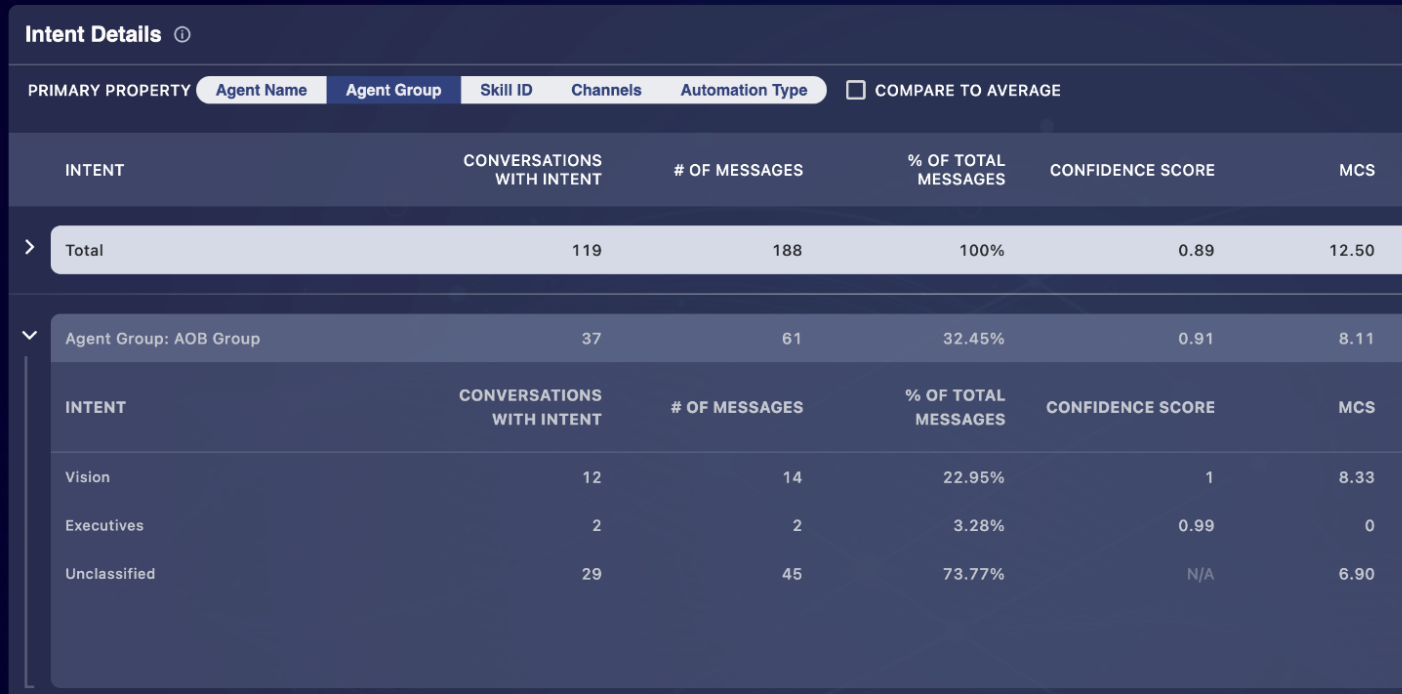
If you expand an agent group, you see the data grouped by intent and only related to that agent group.
To display the difference between a specific value and the overall average value, select Compare to average.
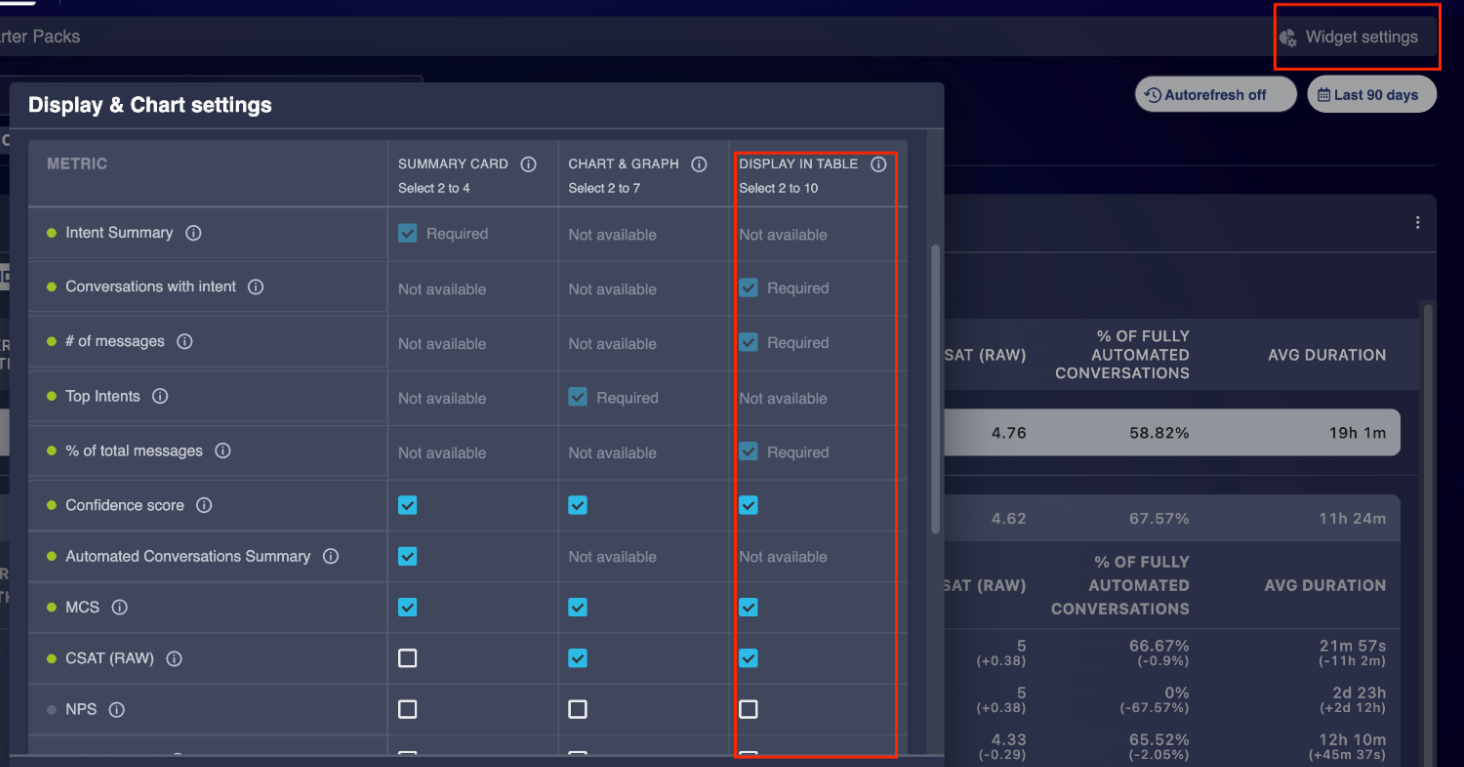
Customize the view
Interested in a different combination of metrics? You can customize which metrics are displayed in the table.
- Click Widget settings.
- In the Display & Chart settings, change the selections under Display in Table. You can select up to 10 metrics to be displayed in the table.