
Introduction
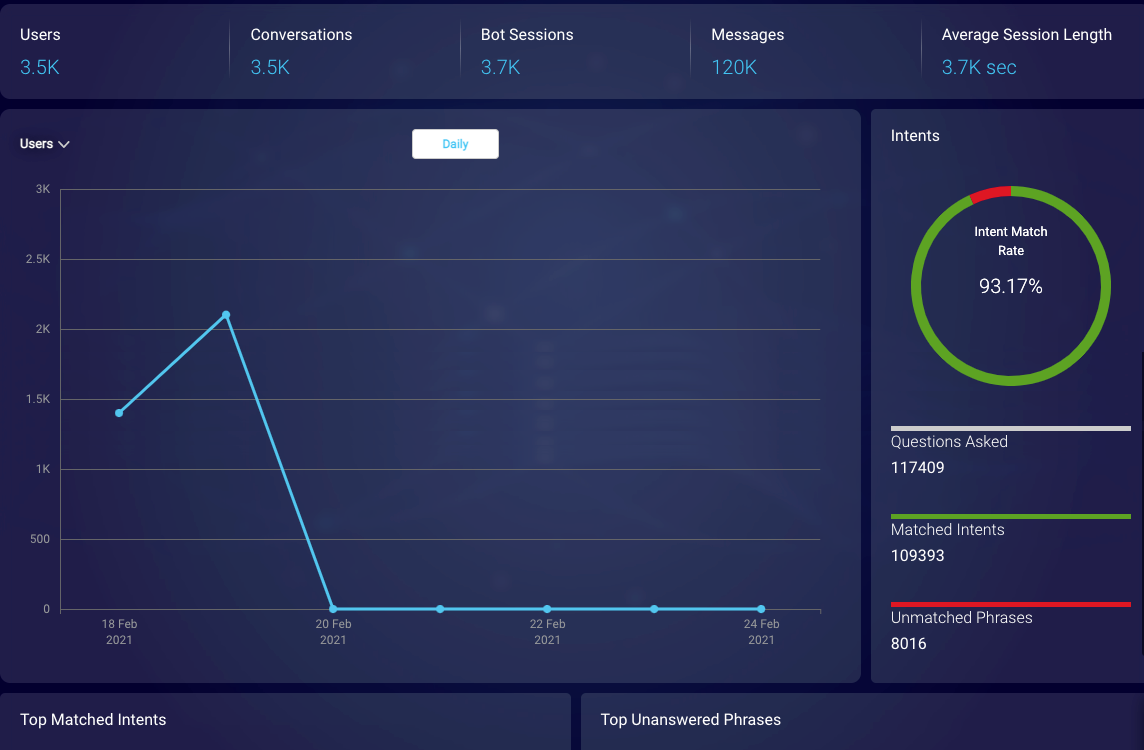
Clicking a bot name on the main dashboard takes you to the bot’s Overview page. This provides a summary of the bot’s performance.
Date range and time zone
In any bot-level view, the date range for the displayed data is shown in the upper-right corner.
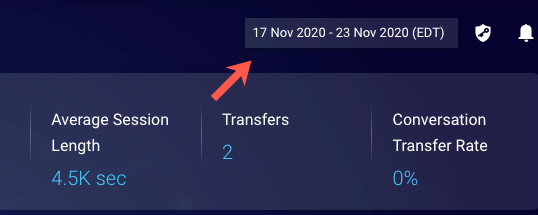
You can use this date filter to show the data for any 60-day date range within the last 13 months. You can also use the date filter to change the time zone in use.
Views and measures
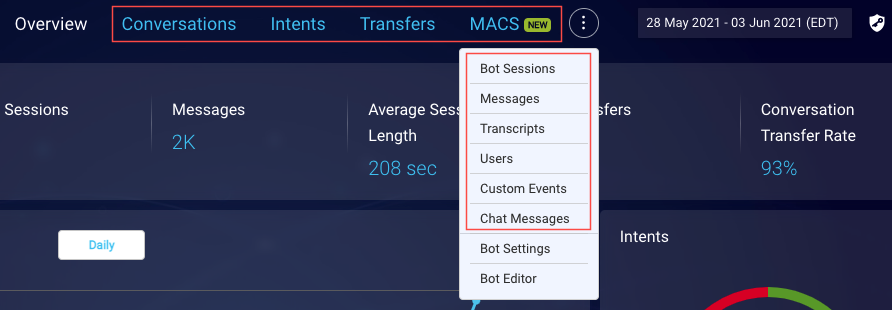
From the Overview, you can access additional views for more detailed information. A few, important views are accessible directly from the menu bar; the rest are accessible from the dropdown menu.
Use the views to understand the bot's performance, for example:
- Use the MACS view to understand the bot's Meaningful Automated Conversation Score, or MACS. This view is great for performing a targeted review of transcripts.
- Use the Users view to understand volume. This view displays the number of unique consumers that connected to the bot.
Some measures that are useful to assess while monitoring and improving your bots include:
Usage
- What day and time were your bots active the most?
- How many users were presented and connected to the bot?
- How many interactions did the bot have with the consumer?
- Is usage tied to any known external issues, e.g., service outages, supply chain issues, or social disruption?
Intents
- Which intents do you successfully serve through the bot today?
- Which intents perform better than others?
- Does the bot design misunderstand the way consumers express their intents?
- Does the bot fail? How often does it happen?
- What is the bot’s intent match rate?
Engagement
- How many users stayed through the entire bot flow?
- Did they make it through what you consider the complete happy path to intent resolution?
- Did they express any negative feedback or run into unforeseen problems?
- How many conversations encountered fallback?
Transfers
- Was the bot equipped with all the resources needed to satisfy the consumer's intent?
- How often did an experience end up getting transferred from a bot to a human agent?
Bot Operations
- Is the system performing as designed?
- Showing dialogs and transferring users through the intended path
- Presenting accurate information at the desired time
- Handling the quantity of interactions in an efficient manner
Download data
All bot views except the Overview and the MACS view, let you download the results to a CSV file. Click the Download icon in the upper-right corner.
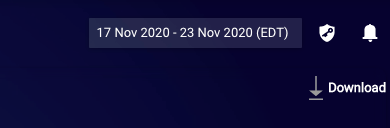
You can query for and download data for any 60-day time period in the last 13 months. If you need to download at one time the data for a longer time period, use Analytics Builder.
All downloaded data represents dates and times in UTC.
When downloading custom events in specific, the limit is 100,000 in number.