
Watch the video
Introduction
A Meaningful Automated Conversation Score (MACS) is a measure of the quality of a bot conversation.
LivePerson has found through research that consumer effort is a key determiner in how the consumer perceives the quality of a conversational experience. Given this, MACS is calculated by identifying and quantifying this using proprietary LivePerson AI logic. Issues within the bot conversation’s structure are detected and used to derive a score, for example:
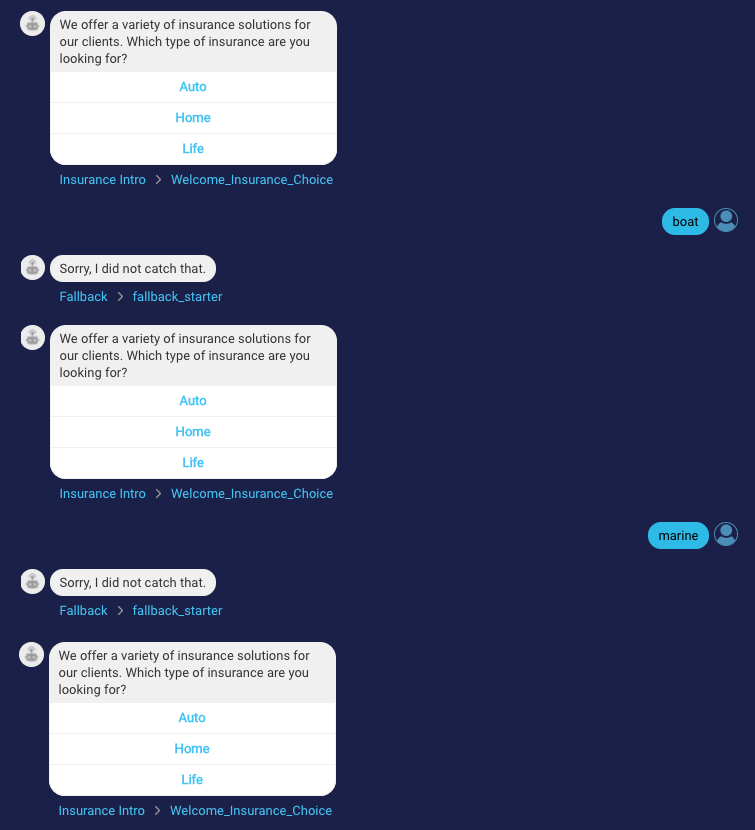
- Did the bot understand the consumer’s question?
- Was the consumer stuck in an endless loop?
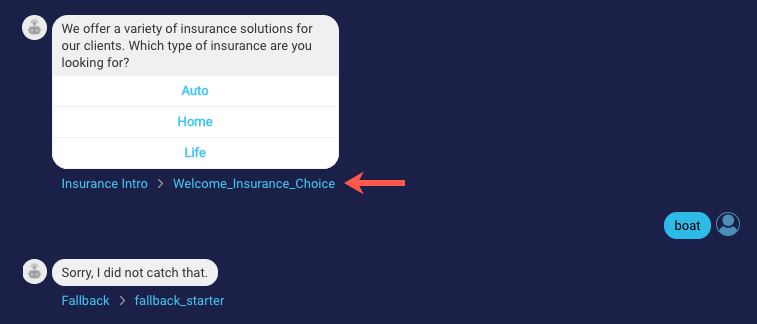
Here is a conversation with these example issues:
MACS is calculated for a bot conversation based on issues like those above. The conversation is classified with MACS 1, 2 or 3 where:
| Score | Icon | Description |
|---|---|---|
| 1 |  |
A potentially below average conversational experience was detected. Issues were found. The bot is unhelpful and needs immediate attention. |
| 2 |  |
A potentially average conversational experience was detected. Some issues were found. The bot is still helpful but needs improvement. |
| 3 |  |
A potentially good conversational experience was detected. Almost no issues were found. The bot still might need more tuning. |
Within Bot Analytics, you can review in-depth MACS data for your bots. This data helps you to quickly identify underperforming bots, find their issues, and move to bot/intent tuning for enhanced performance.
Before you begin
Before you begin working with MACS in Bot Analytics, please see this topic in the Community Center for an extensive introduction to MACS, its benefits, information on how MACS is scored, solutions for improving scores, and more.
Main dashboard
The main dashboard in Bot Analytics displays each bot’s average MACS (a floating number) for the specified date range. This helps you to understand at a glance which of your bots are working well, and which are not working as expected and need further tuning.
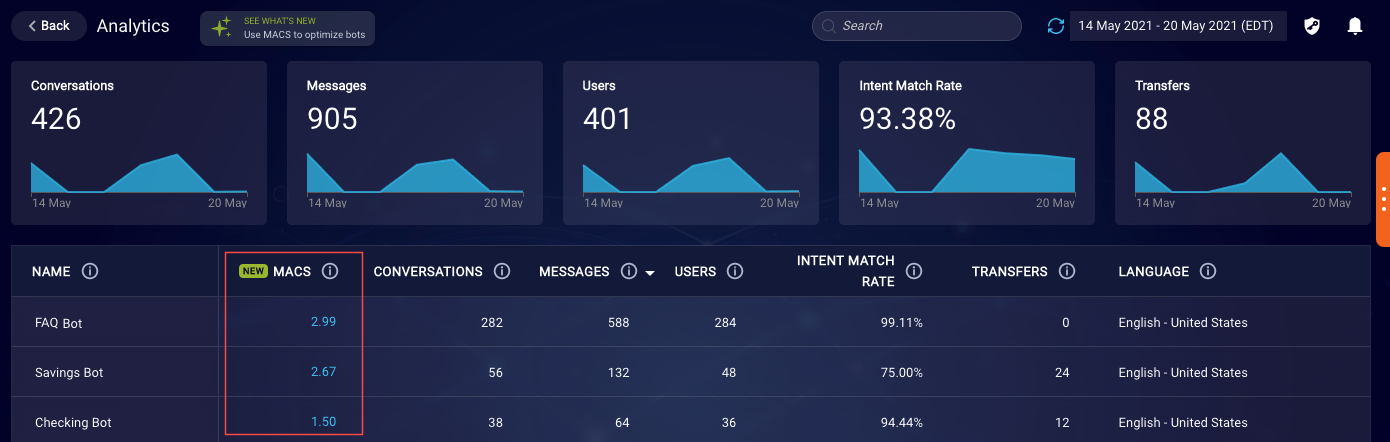
When assessing the MACS of your bots, keep in mind that MACS primarily is meaningful for bots that accomplish specific business purposes through the use of conversation flows. The score isn’t as meaningful for other types of bots, e.g., routing bots and FAQ bots.
On the main dashboard, click a bot’s MACS to go to the MACS page for the bot. Here you’ll see more information that helps you understand the bot’s MACS.
Understanding the charts
There are several charts on the MACS page to help you understand the bot’s performance.
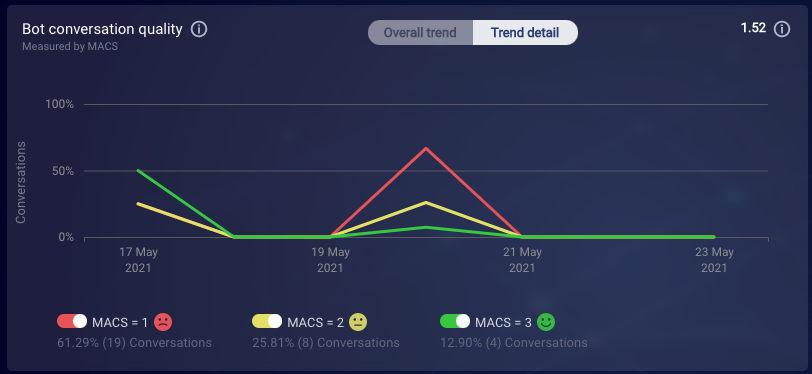
Overall trend
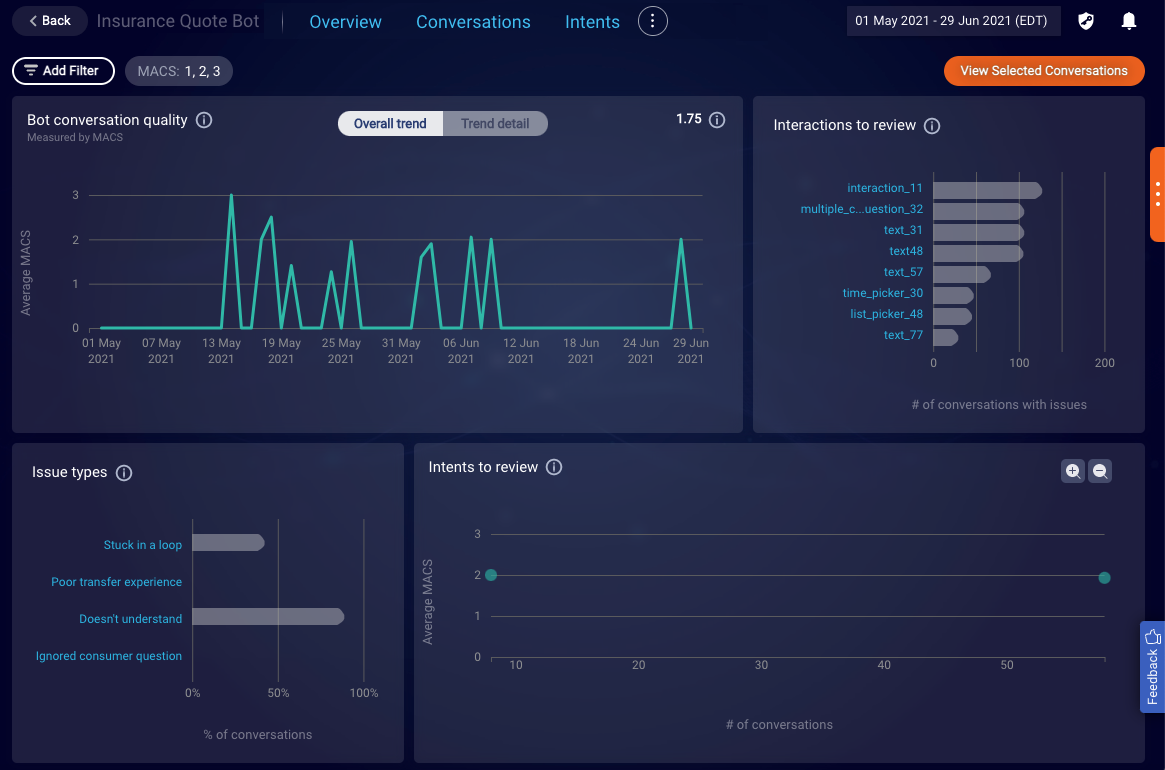
The Overall trend chart displays the average MACS for the bot. Use this graph to understand the bot’s overall MACS trend for the specified date range.
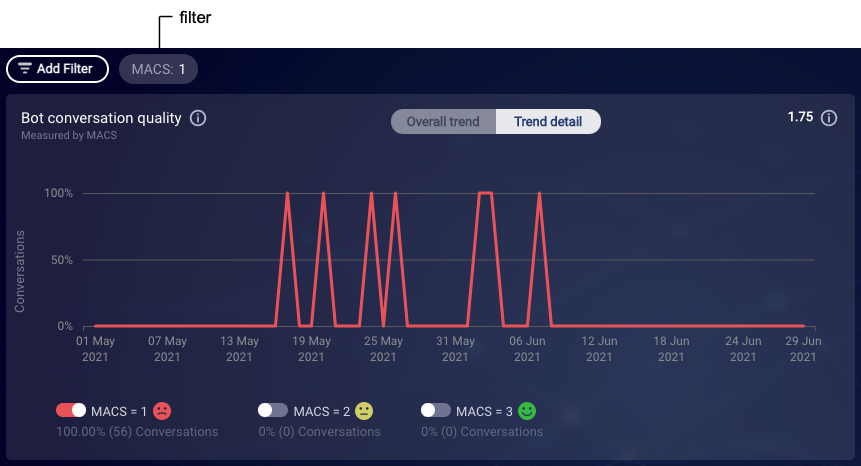
Trend detail
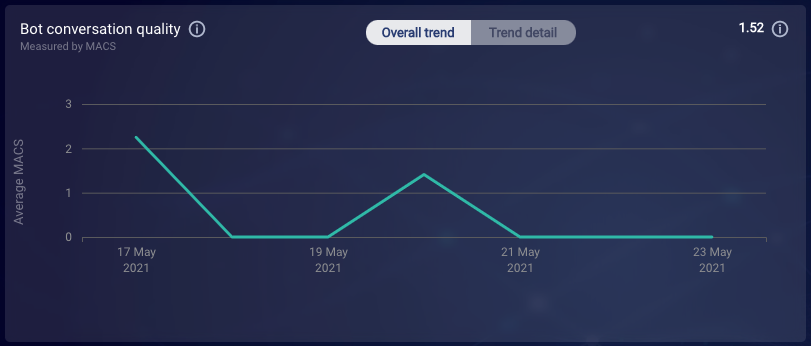
The Trend detail chart displays the distribution for each MACS scale: 1, 2 and 3. Use this chart to understand the trend of each MACS scale for the specified date range.
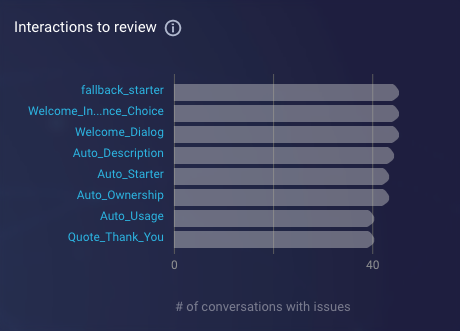
Interactions to review
The Interactions to review chart displays the top eight, most used interactions that appeared in low-scoring conversations with issues. Use this to determine if bot interaction tuning might be needed. An interaction displayed in this graph might not be the cause of issues, but the relationship can suggest that further investigation is needed.
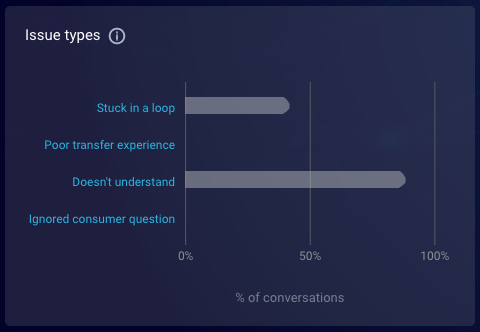
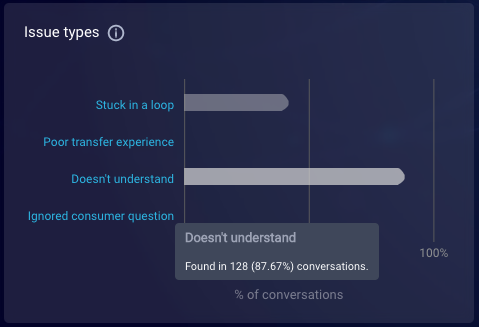
Issue types
The Issue types chart displays the distribution of issues types that were found in conversations within the specified date range. The issue types are potential friction points (failure points) detected in conversations; they affect the conversation’s MACS.
Use these issues types to understand how the consumer’s experience was impeded and to discover bot tuning opportunities. Learn about possible fixes in the Community Center.
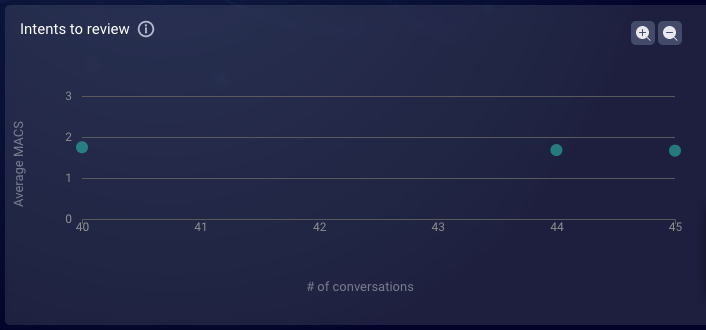
Intents to review
The Intents to review chart visualizes the intents that were found in the bot’s conversations within the specified date range. Focus on the lower-right quadrant to identify intents that are most used in low-scoring conversations, to discover opportunities for intent tuning. An intent that’s used in a low-performing bot might not be the cause of issues, but the relationship can suggest that further investigation is needed.
Using the charts
In a chart, move your mouse over an element to see more information.
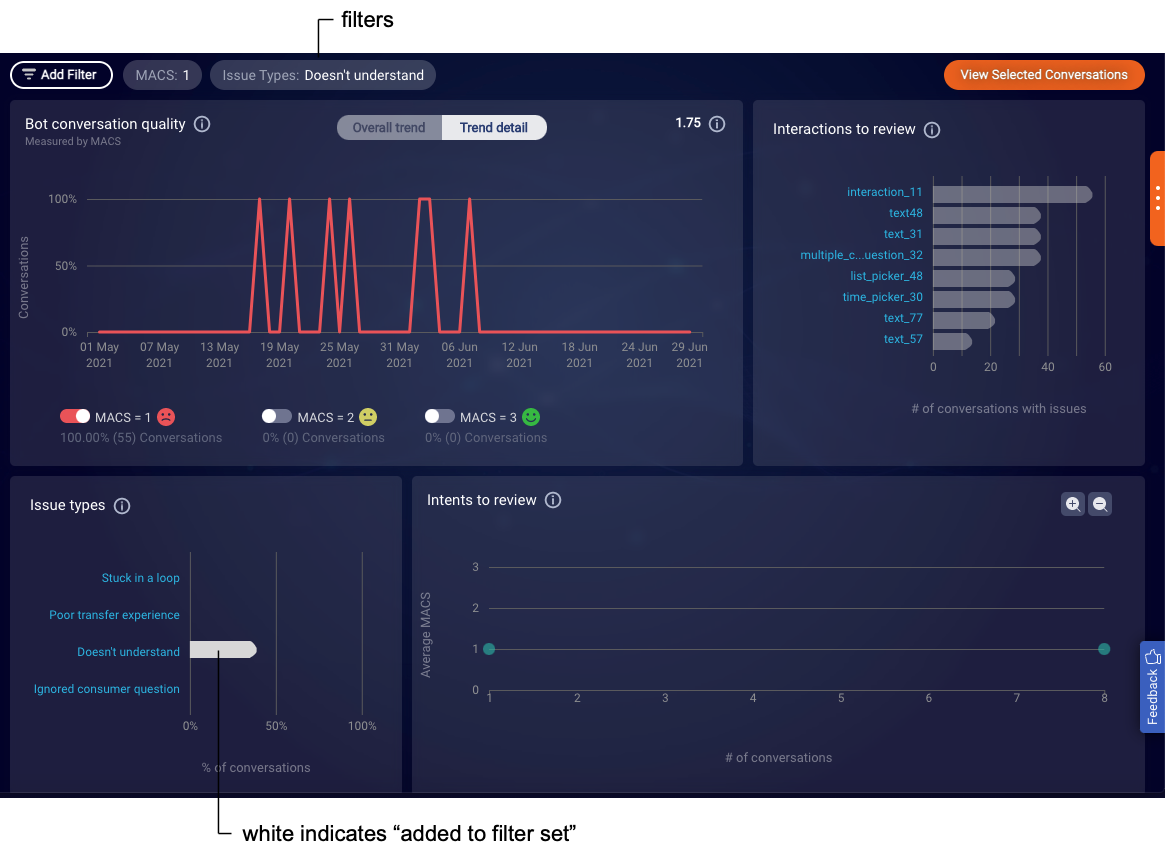
In general, use the charts to build a set of filters at the top of the page. The purpose of building the set of filters is to define the criteria for the conversations that you want to view.
In the Trend detail chart, you can use the three toggles at the bottom to show and hide the display of an individual MACS. This adds a filter to the top of the page.
In the other charts, you can select one or more interactions, issue types, and/or intents to likewise add filters to the top of the page. In the chart itself, this changes the element’s color to white to indicate it is added to the filter set.
Note the following about adding filters.
- When you add a filter from a chart, this updates that chart and all others except the Overall trend chart. The Overall trend chart doesn’t impact the other charts, nor is it impacted by the other charts.
- Within a filter, an “OR” search is performed. Across the filter set, an “AND” search is performed. For example, you can show the data where ((score equals MACS 1 OR MACS 2) AND (MACS reason equals “Stuck in a loop” OR “Poor transfer experience”)).
- The system is configured to display Issue type data only when a particular issue type is measured in a conversation above a certain, internal threshold, called a “confidence threshold.” As a result, when you filter the data by Issue type, only conversations where the confidence threshold that the issue exists is met are displayed. This ensures there is high confidence with respect to the displayed data.
Viewing conversations
Once you’ve used the MACS charts to build the set of filters at the top of the page (1), click View Selected Conversations in the upper-right corner (2).
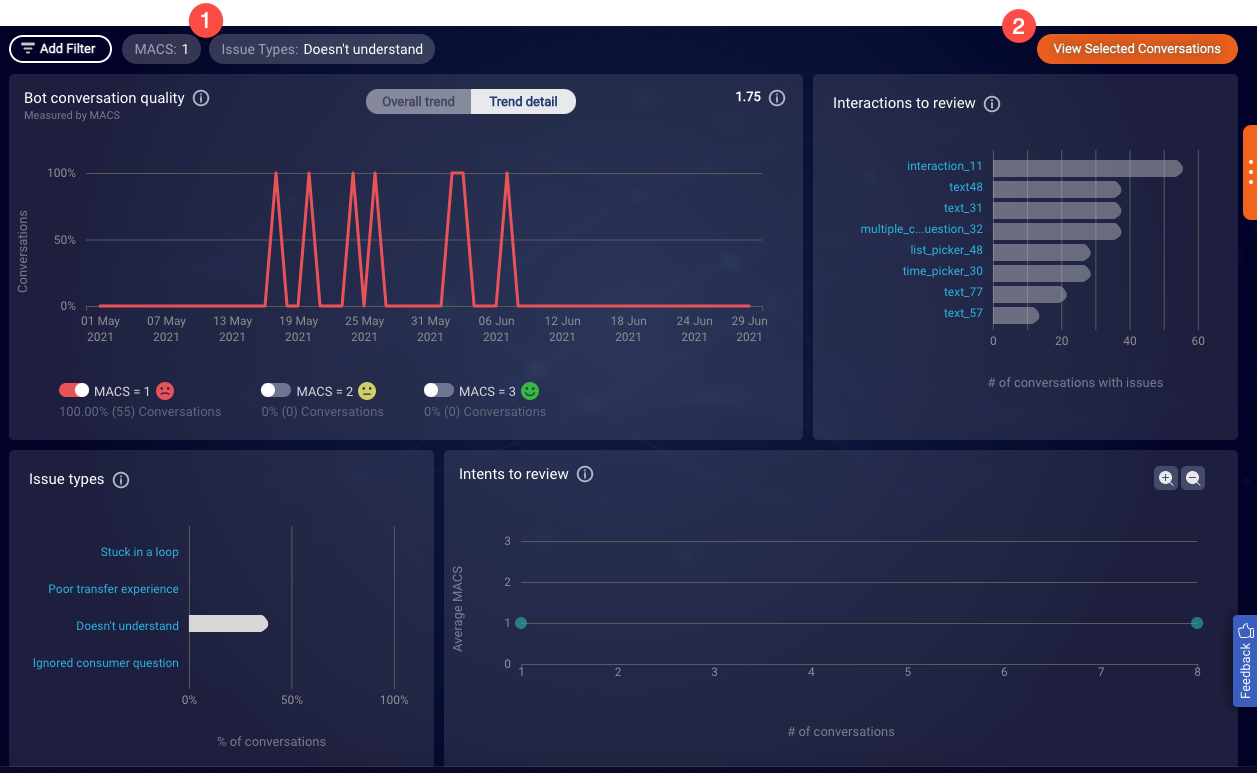
This takes you to a list of conversations (as many as 100) that are filtered based on the criteria you’ve specified.
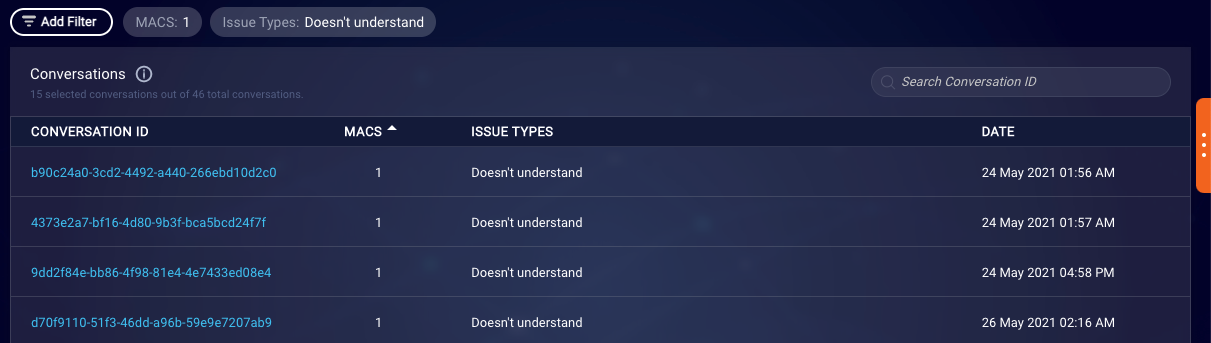
The conversations in the list are distributed across the selected scores, so, for example, if you select to show conversations with MACS 1 and MACS 2, you’ll see some number of conversations with MACS 1 and some number of conversations with MACS 2. The distribution might not be even since this depends on the data that’s available.
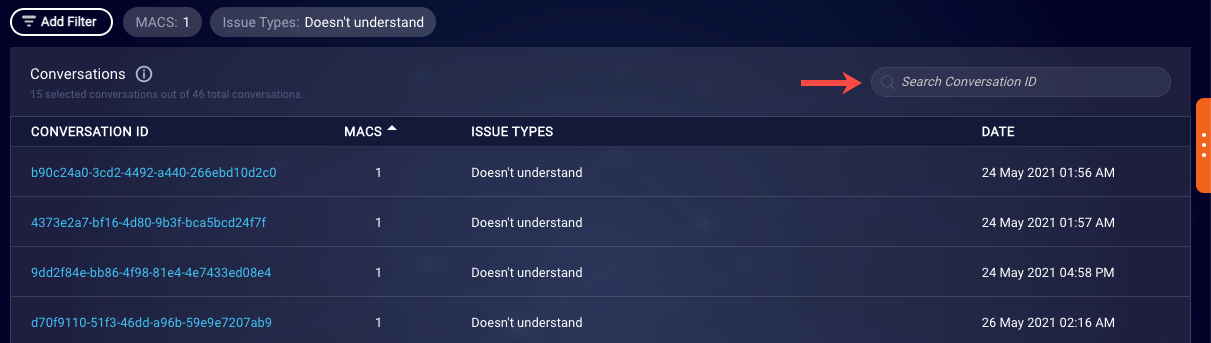
From here, you can also search for a specific conversation: Enter its full conversation ID in the search box. The conversation will be displayed in the Conversations list regardless of how the other filters are set.
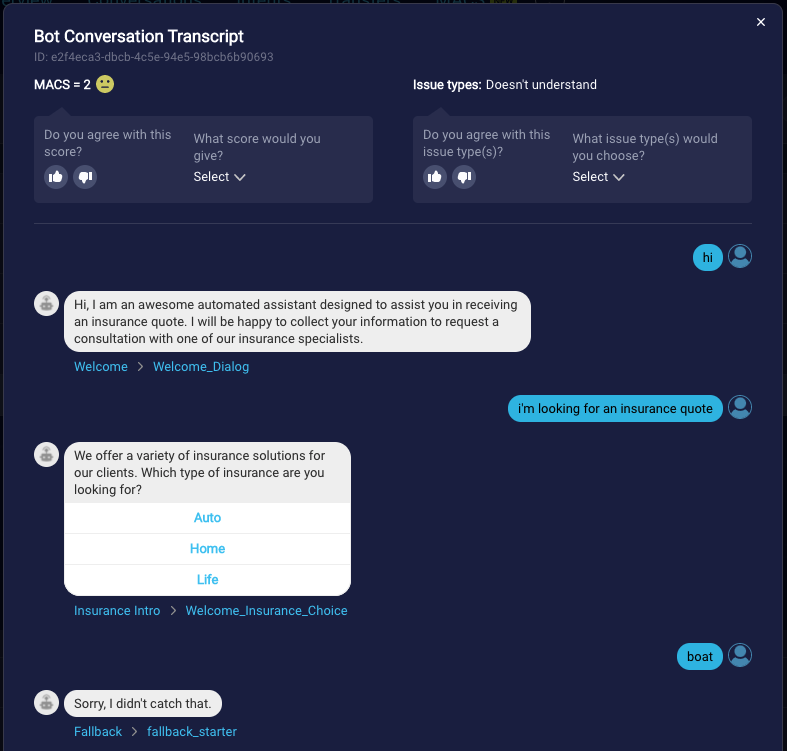
Reviewing a transcript
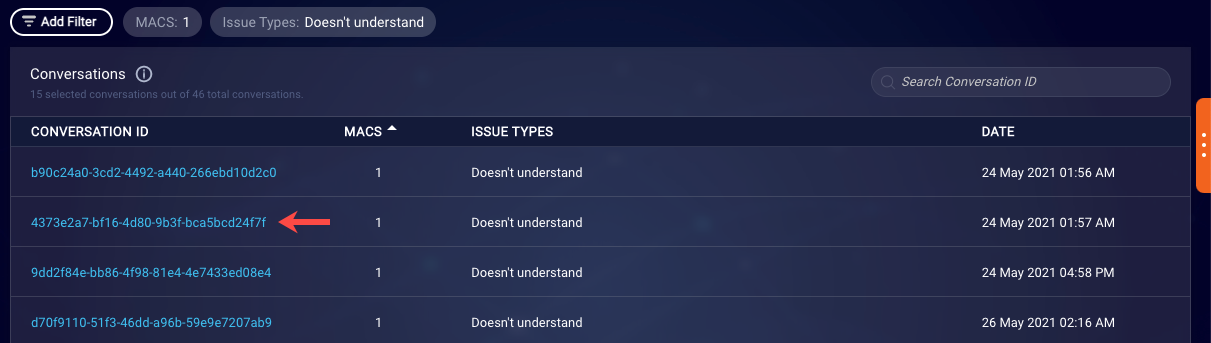
With a list of conversations displayed, select a conversation to review its transcript.
Within the transcript, you can then identify the failure point.
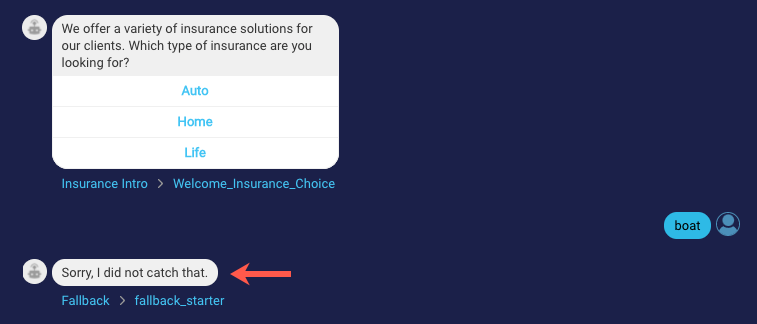
Next click the link for the interaction that is causing the failure.
Clicking the link opens the bot in LivePerson Conversation Builder and displays that interaction in the dialog editor. You can then tune the bot right at the failure point, for improved performance.

Sending feedback
LivePerson is interested in your feedback regarding MACS, as we use that information to determine how well the automated conversation quality scoring aligns to your expectations.
After reviewing a conversation transcript, please use the feedback widget at the top to comment on both the conversation’s MACS and the issue types that were found.
FAQs
For one of my bots, the Conversations metric doesn’t equal the sum of all conversations that received a MACS 1, 2 and 3. Why is this?
On the bot's Overview page, the Conversations metric represents the total number of closed and open Conversational Cloud conversations in which the bot participated.
On the bot’s MACS page, the counts of conversations receiving a MACS 1, 2 and 3 are for closed conversations.
Since a MACS isn’t calculated for open conversations, the two metrics can be different at times.
In the Conversations list, I see conversations that have a MACS, but there are no associated issue types. How can a score be assigned to a conversation if there are no issues detected?
The issue types detected in a conversation point towards issues with the bot’s responses, and they’re used to assign a MACS to the conversation.
However, internally within the system, each issue type has an assigned “confidence threshold.” To ensure high confidence regarding issue type data, the system is configured to highlight only the issue types that meet or exceed their thresholds. As a result, it’s possible to see a conversation with a MACS but with no detected issue types. When this happens, it doesn’t necessarily mean that no issue types were found. It means that no issue type was found where its threshold value was met.
If there are no significant issues detected, the conversation typically has higher quality and receives a higher score. There are exceptions to this, as our issue types do not capture all possible issue scenarios and do not have perfect accuracy.
On the Bot Conversation Transcript page, you’ll find a quick and easy feedback feature. We encourage you to send us your feedback on a conversation’s MACS and the identified issue types. This helps us to tune and improve the MACS AI logic.
I set a filter to show conversations where the bot didn’t understand (Issue type = Doesn’t understand). But in the Conversations list, I see conversations where other issue types are found too. Why is this?
A single conversation can have multiple issues within it. So if you filter the results using one issue type (or a few), you might see conversations that include those issue types as well as others.
One of my conversations has multiple scores assigned to it. Why is this?
A conversation can have multiple “legs,” where a “leg” in a conversation starts with one agent, and it ends when the conversation is transferred to another agent. Multiple legs of a conversation have the same conversation ID.
A MACS is calculated for each leg of a conversation, so you might see a single conversation with multiple MACS.
Is the “Interactions to review” chart showing me all the bad interactions in the bot?
Not necessarily. The chart displays the top eight interactions that are most used in conversations with low scores and high confidence that issues were detected. The chart doesn’t necessarily give you a list of all possible bad interactions in the bot. Use the chart as a list of interactions with potential tuning opportunities.