
Overview
The bot status dashboard provides a detailed overview for the most important bot KPIs. It features a chronological history of different bot state events, such as online time and interruptions. The dashboard also provides a calculated uptime for the bot.
To track the efficiency of the bot, the dashboard features an overview for the number of handled conversations over time.
The dashboard can be accessed by clicking on the bot's name.
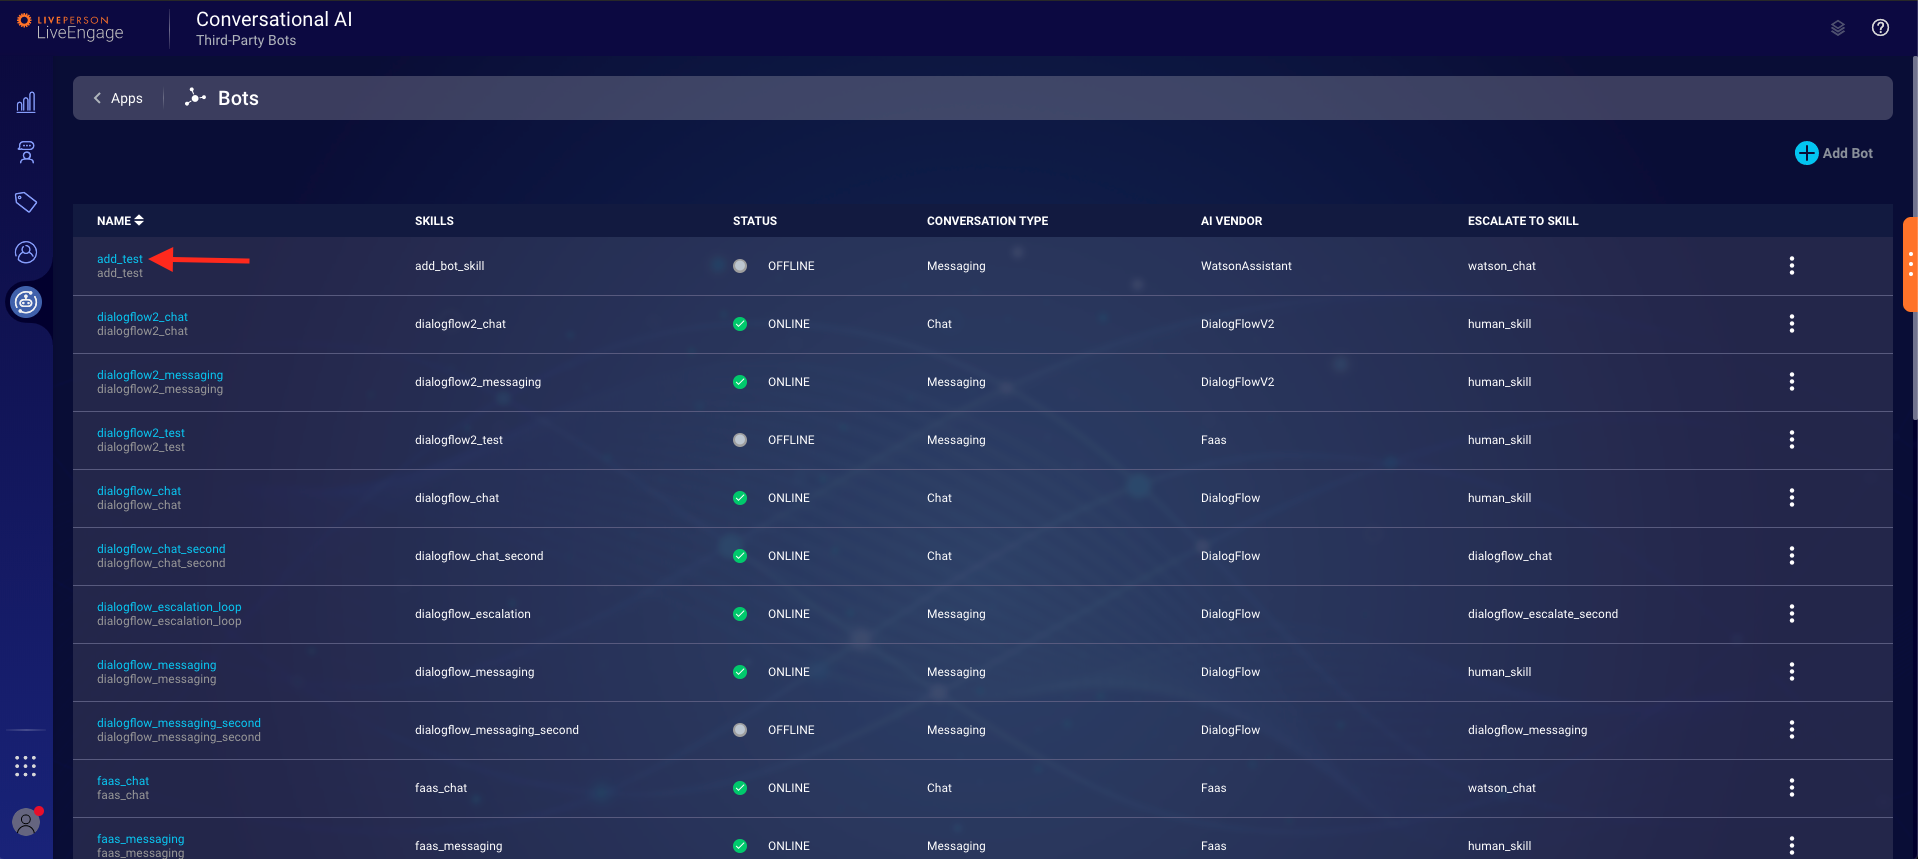
Figure 1.1 How to access the bot status dashboard
Limitations
If the bot is restarted, all previous dashboard data will be cleared.
For a running bot, conversation data is limited to a maximum of 7 days of past data.
Dashboard Views
The user will see the following screen after clicking on the bot's name.
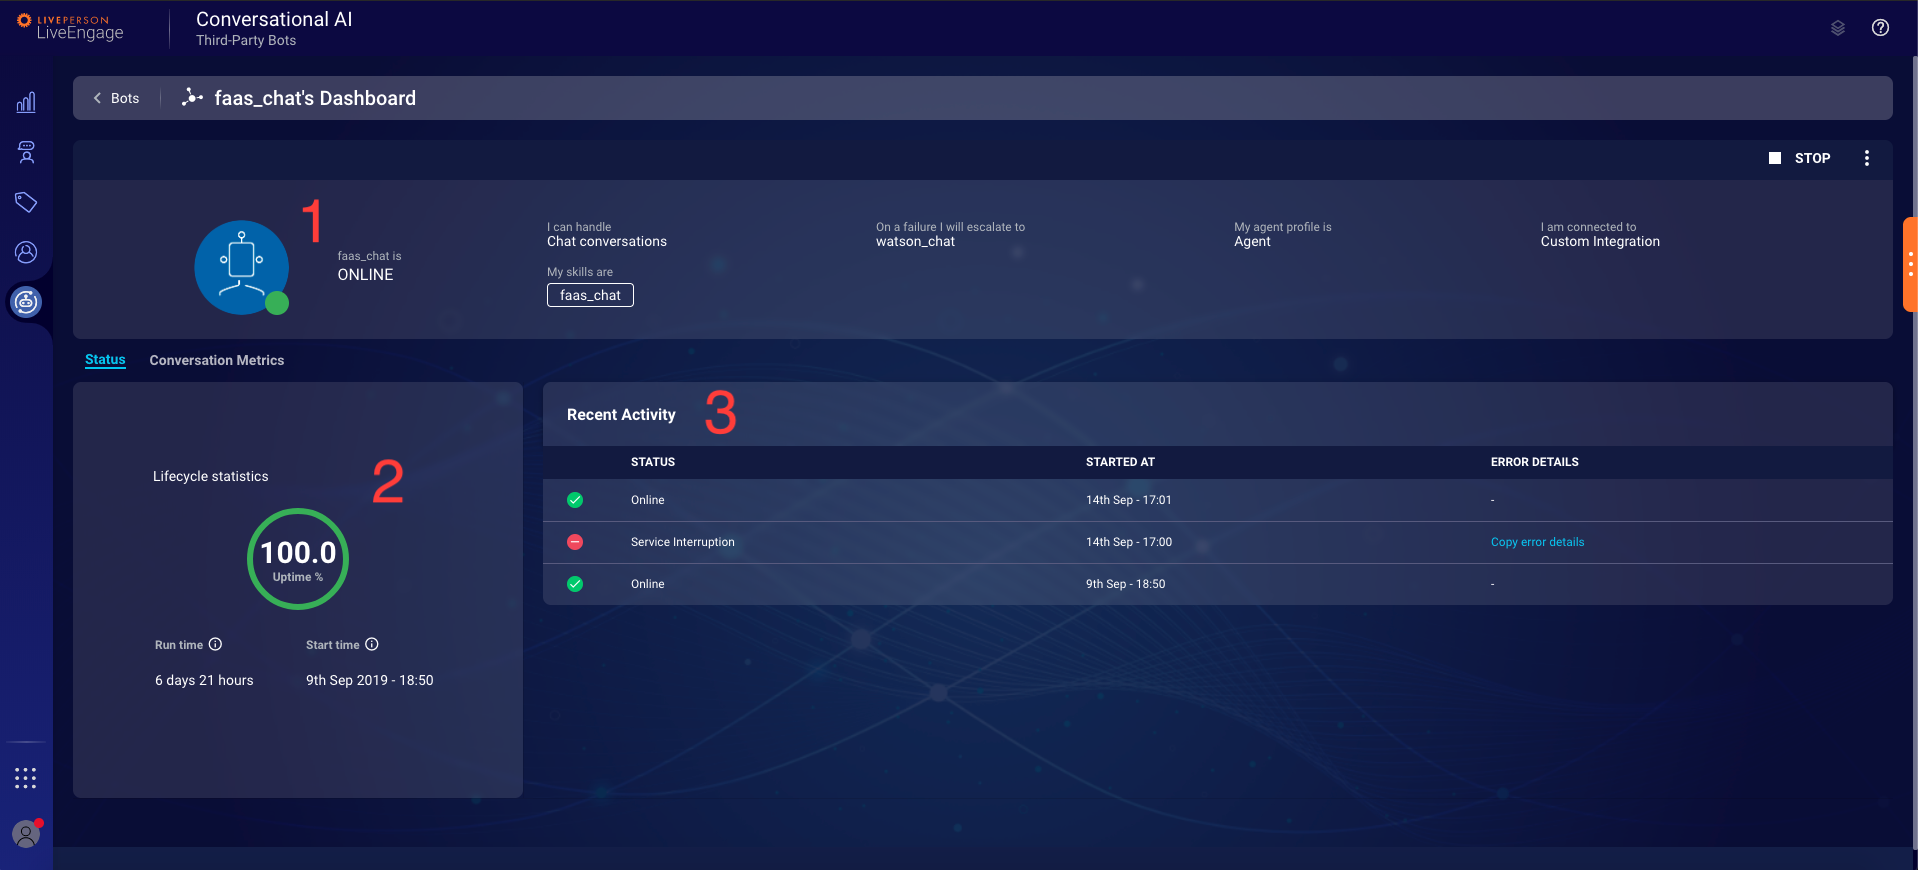
Figure 2.1 Dashboard Main View
In Section 1 of Figure 2.1, the dashboard provides a short configuration overview for the selected bot. The user can see the following:
- connection type to Conversational Cloud (either Chat or Messaging)
- failover skill
- the profile the bot user has been assigned to
- configured A.I. Vendor
- skills which are assigned to the bot
Status
In section 2 of Figure 2.1, the dashboard provides a chronological history of bot state events and an overview of the bot's overall uptime.
In section 2 of Figure 2.1 the user can see the overall calculated uptime, the bot's start time and online runtime.
In section 3 of Figure 2.1 the user can see different bot states events. The bot can have 4 different states: Online, Vendor Interruption, Service Interruption, and Offline.
The Vendor Interruption state indicates that there is an error reaching the configured AI vendor. In this case the bot will escalate each conversation to the configured failover skill.
In case of a Service Interruption, the bot is not functioning at all. In this state the bot cannot accept new conversations or handle existing conversations. This state indicates problems with LivePerson APIs.
Each interruption state event provides a specific error code which can be copied by clicking on the "Copy error details" link as seen in section 3 of Figure 3.1.
The error details contain a human readable error message, the error code and an unique error id, which will help support in identifying the root cause of the error.
Conversation Metrics
When selecting the Conversation Metrics tab the bot status dashboard provides an overview of specific bot conversation metrics.
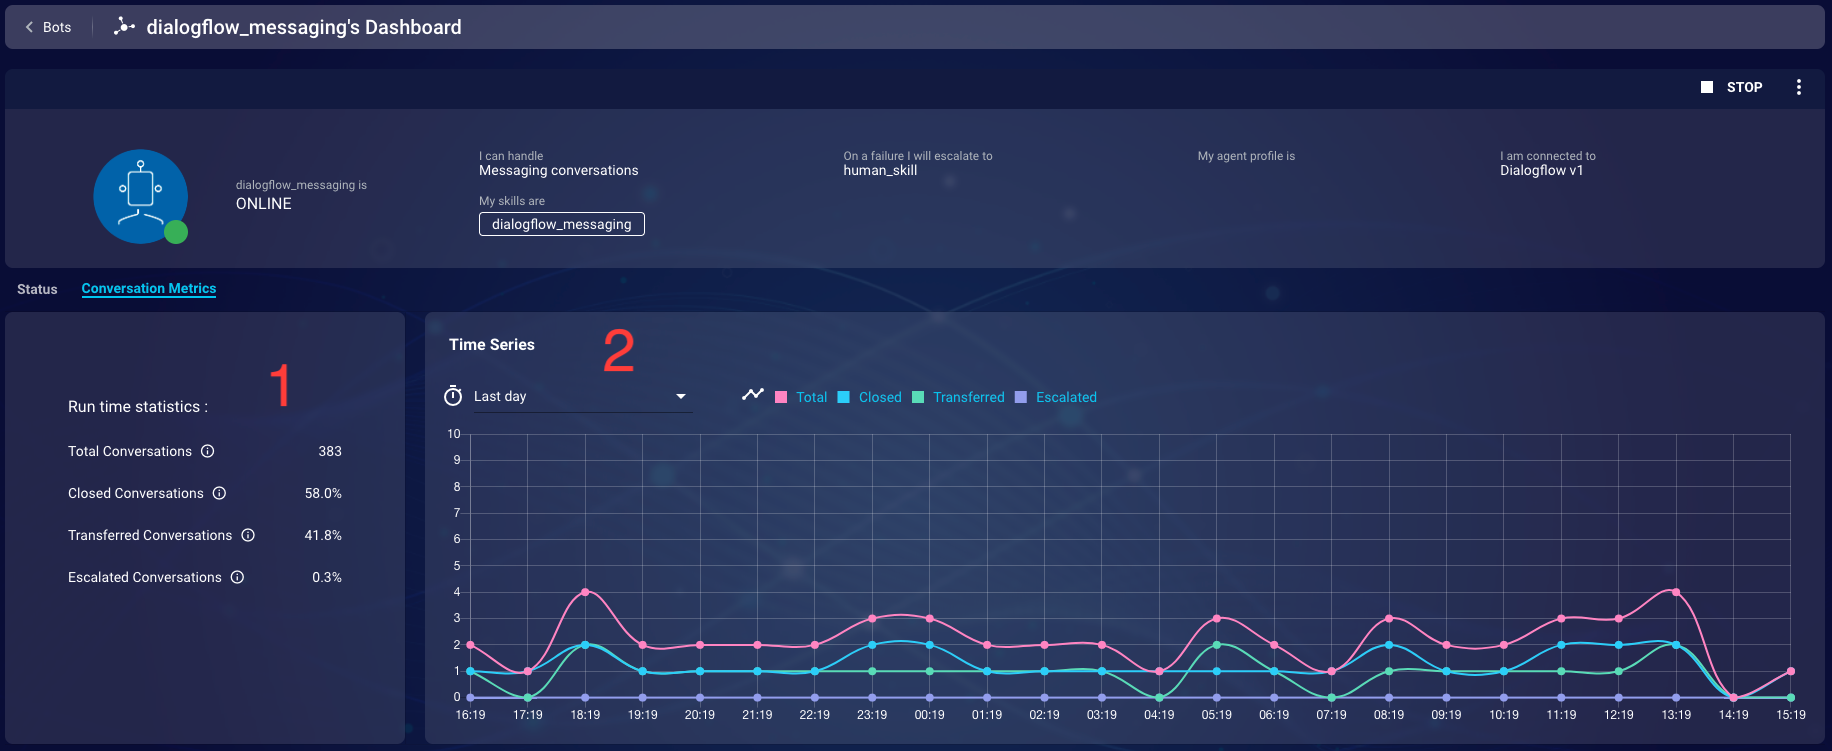
Figure 3.1 Bot conversation metrics
On the left side, in section 1 of Figure 3.1, the user can see the accumulated metrics since the last start. There are currently 4 KPIs:
| Metric | Description |
|---|---|
| Total Conversations | Total number of conversations that were handled by the bot |
| Closed Conversations | Percentage of total conversations that were closed by the bot or the consumer |
| Transferred Conversations | Percentage of total conversations that were transferred to a different skill |
| Escalated Conversations | Percentage of total conversations that were escalated due to an error with the bot |
On The right side, in section 2 of Figure 3.1, the user can see a timeline representation of the conversation metrics. The user can select between various time scales, the smallest is last ten minutes and the biggest is last week.
Conversation Errors
When selecting the Conversation Errors tab the bot status dashboard provides an overview of specific bot conversation errors.
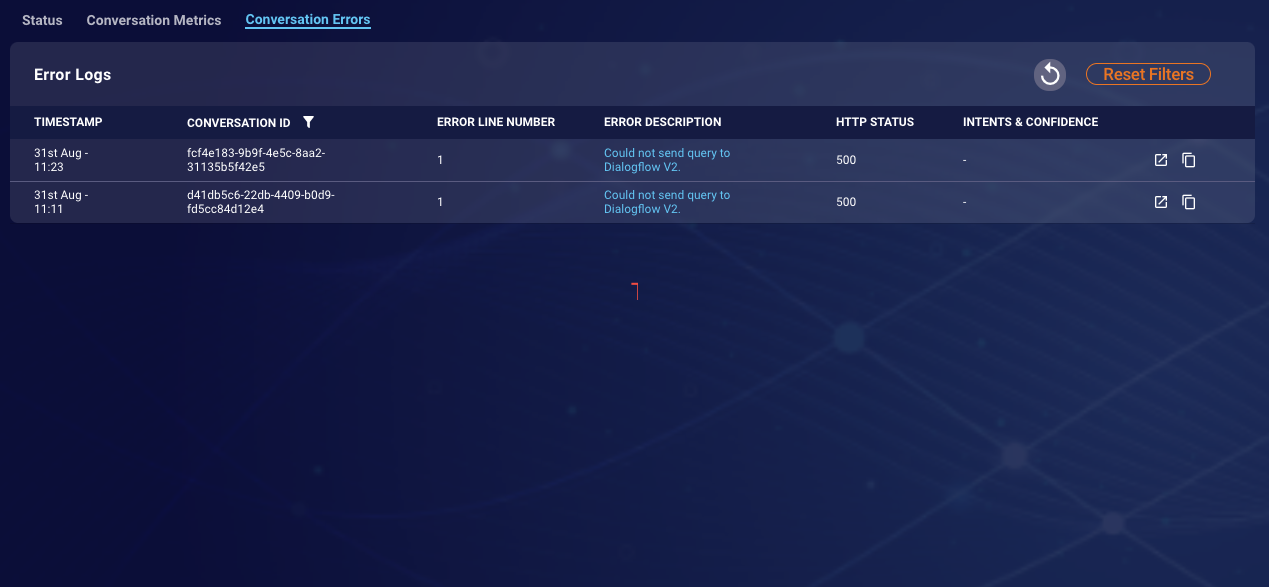
Figure 4.1 Bot conversation error logs
You can filter the errors by conversation id upon clicking the filter button.
If you click on the error description, a new page will be opened with detailed information on how to fix the errors.
Additionally, there is an option to copy the detailed error response for providing this information to LP Support.