
We will introduce you to all the available monitoring features and tools on this page.
Email Reporting
First, we will explain how to configure and enable email reporting for your account. Let's go over some basic information and limitations that need to be considered. You can only select one active report and its frequency. You can choose from the following frequencies:
- None: Disables email reporting
- Daily: 01:00 UTC each day
- Weekly: 01:00 UTC first day of the week
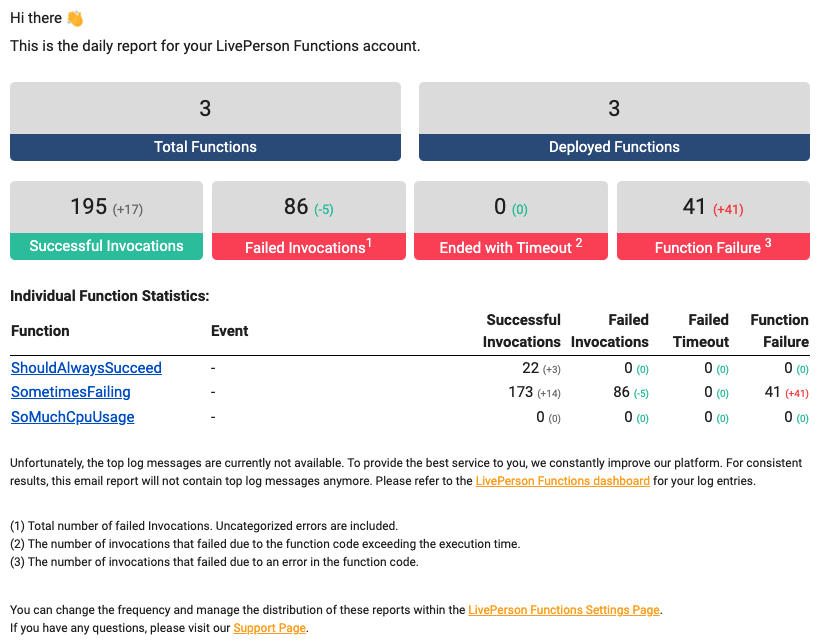
The data is based on the frequency, e.g. Weekly contains the data accumulated over the week while Daily only includes information of the last 24 hours. The email report contains the following information.
Enable Email Reporting
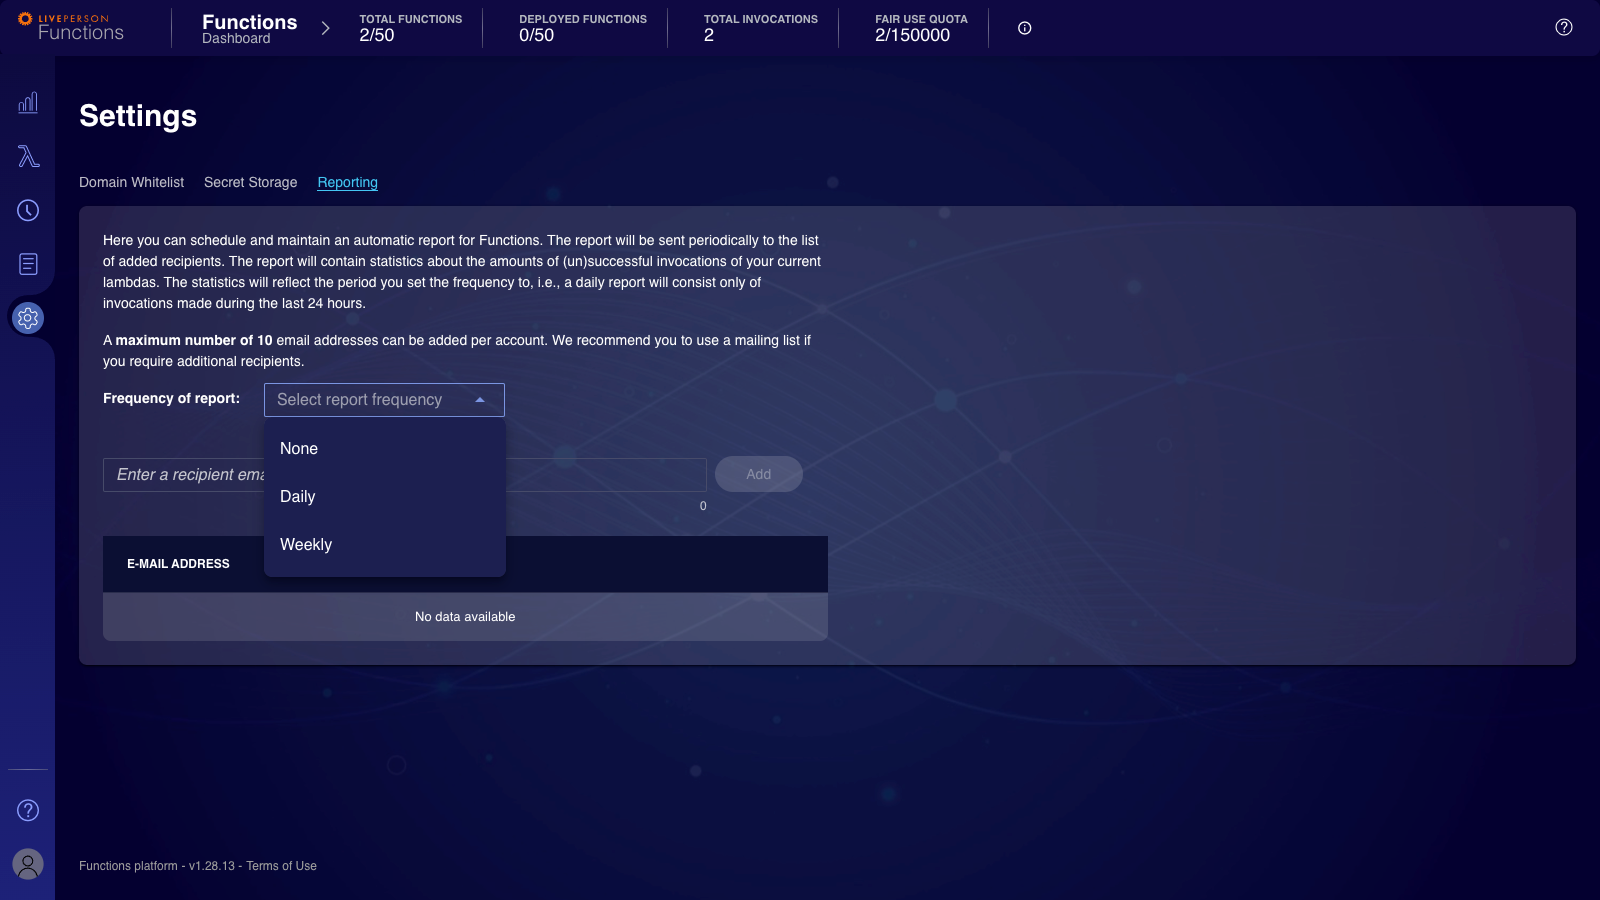
The Email Reporting can be configured via the "Reporting"-tab inside the "Settings"-Page by a user meeting the required permissions. You will observe the currently set frequency and the current list of participants on the page, which are limited to 10 emails. We suggest the usage of mailing lists in case you require more than 10 participants. You can choose from None, Daily and Weekly when clicking on the frequency. Where setting it to None will disable the email reporting.
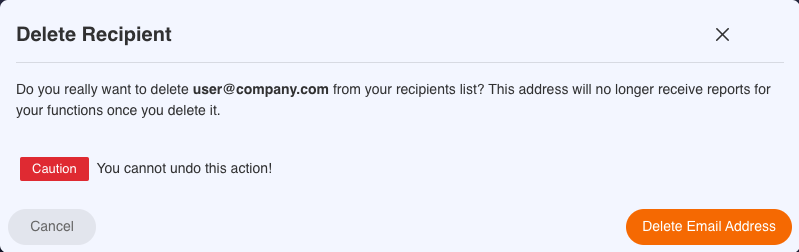
Insert a valid email address and click the "add"-button to add a new participant. You may remove users from the list by using the "Trash"-button next to the email. You must confirm your action by pressing "Delete Email Address".
Logs
We have improved our logging experience available for new functions and older functions once they are redeployed. See the V.1.37 release notes for further information.
Within your function code, you can write logs of different levels. Those are then later accessible for analysis and troubleshooting of potential issues. You can write logs using console.level (e.g. console.info), where we offer the following levels:
- Debug
- Info
- Warn
- Error
Logs written as part of a test invocation will not be stored permanently. Further Debug logs are never stored and will be only visible as part of test invocations, allowing to debug and verify without the risk of having sensitive data leak into persistent logs.
The following code will show the JavaScript interface along with examples that should highlight the use of optional extras:
    // Message needs to be a string
    // Extras is optional and can be left out
    // Extras can be any JSON parsable values like Objects, Numbers or Strings
    console.level(message, extras?);

    // An example using the info level and providing extras
    console.info('Called my backend', { conversationID: '1234-1421-3123', userID: '1234567' });
    // An example using the warn level and providing no extras
    console.warn('Failed to connect to my backend will retry');
Reviewing Logs
There are persisted logs and non-persisted logs. Non-persisted logs are best used to test functions. Those logs can be found in the "Logs" container on the "Invoke your Function"-Page. It may sometimes contain warnings that inform you about potential issues with your logging, as shown in the following screenshot:
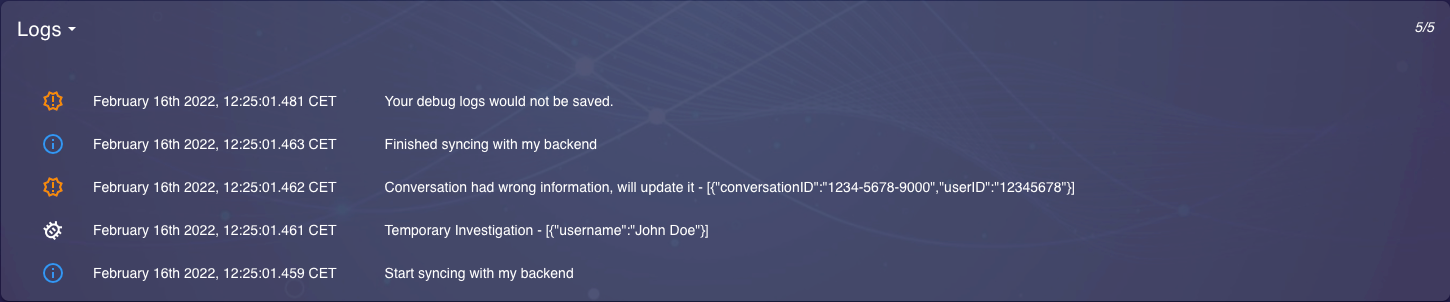
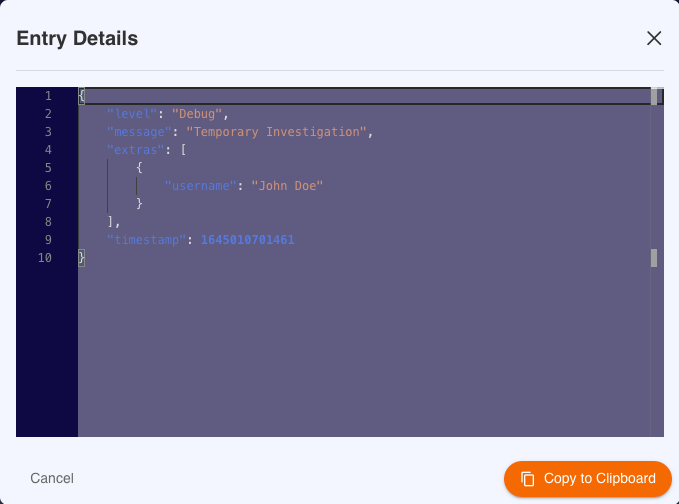
You may click on any individual log entry to open up a dialogue that shows you the full logline and allows you to copy it to your clipboard.
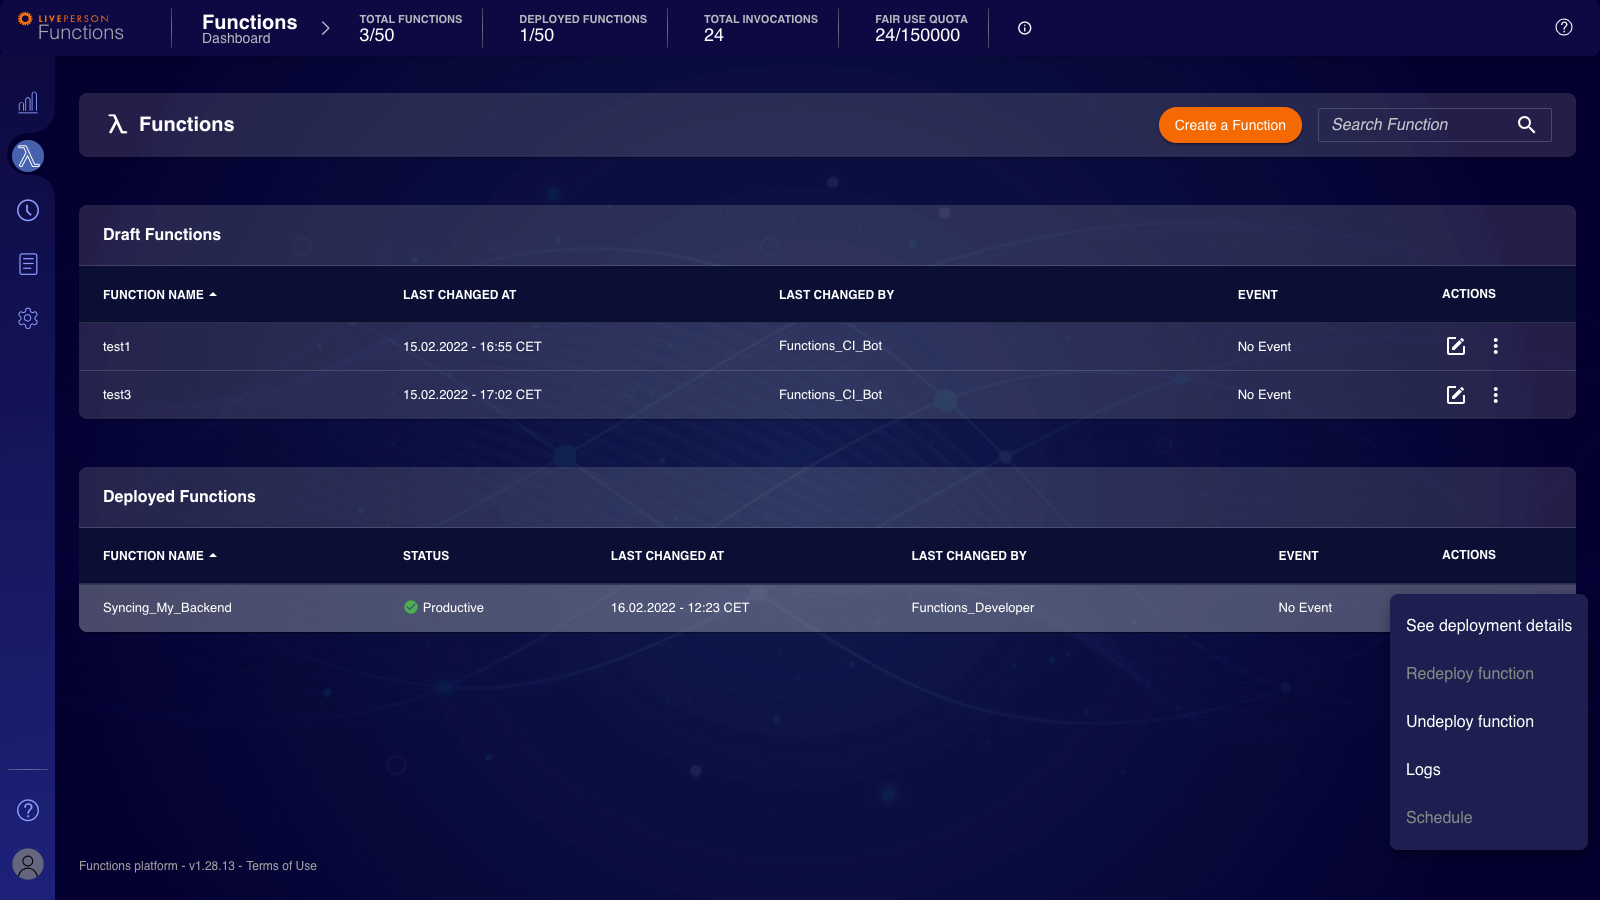
You can find all persisted logs either by using the "Logs"-Entry from the context menu in the Functions Overview or by clicking the "Logs" icon located at the sidebar on the left-hand side.
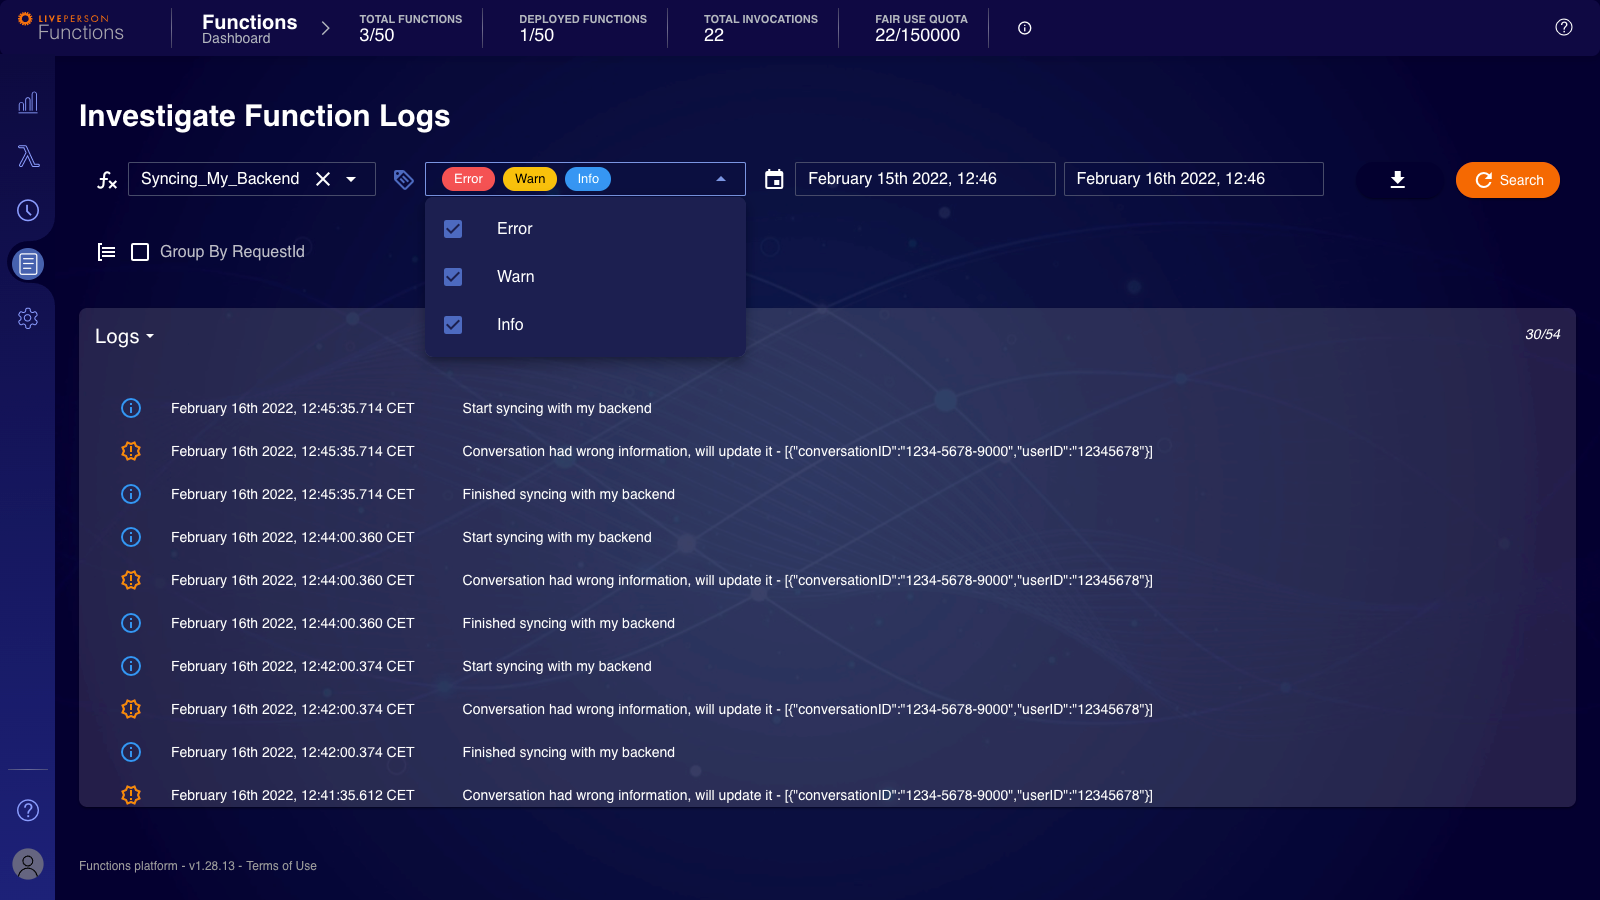
If you do not navigate to the "Investigate Function Logs" page using the context menu, you must select the function from the dropdown list. All log levels are included in the search by default, but you can remove unwanted levels. Further, the time window by default is one day from now, but it can be extended up to 7 days within the last 14 days.
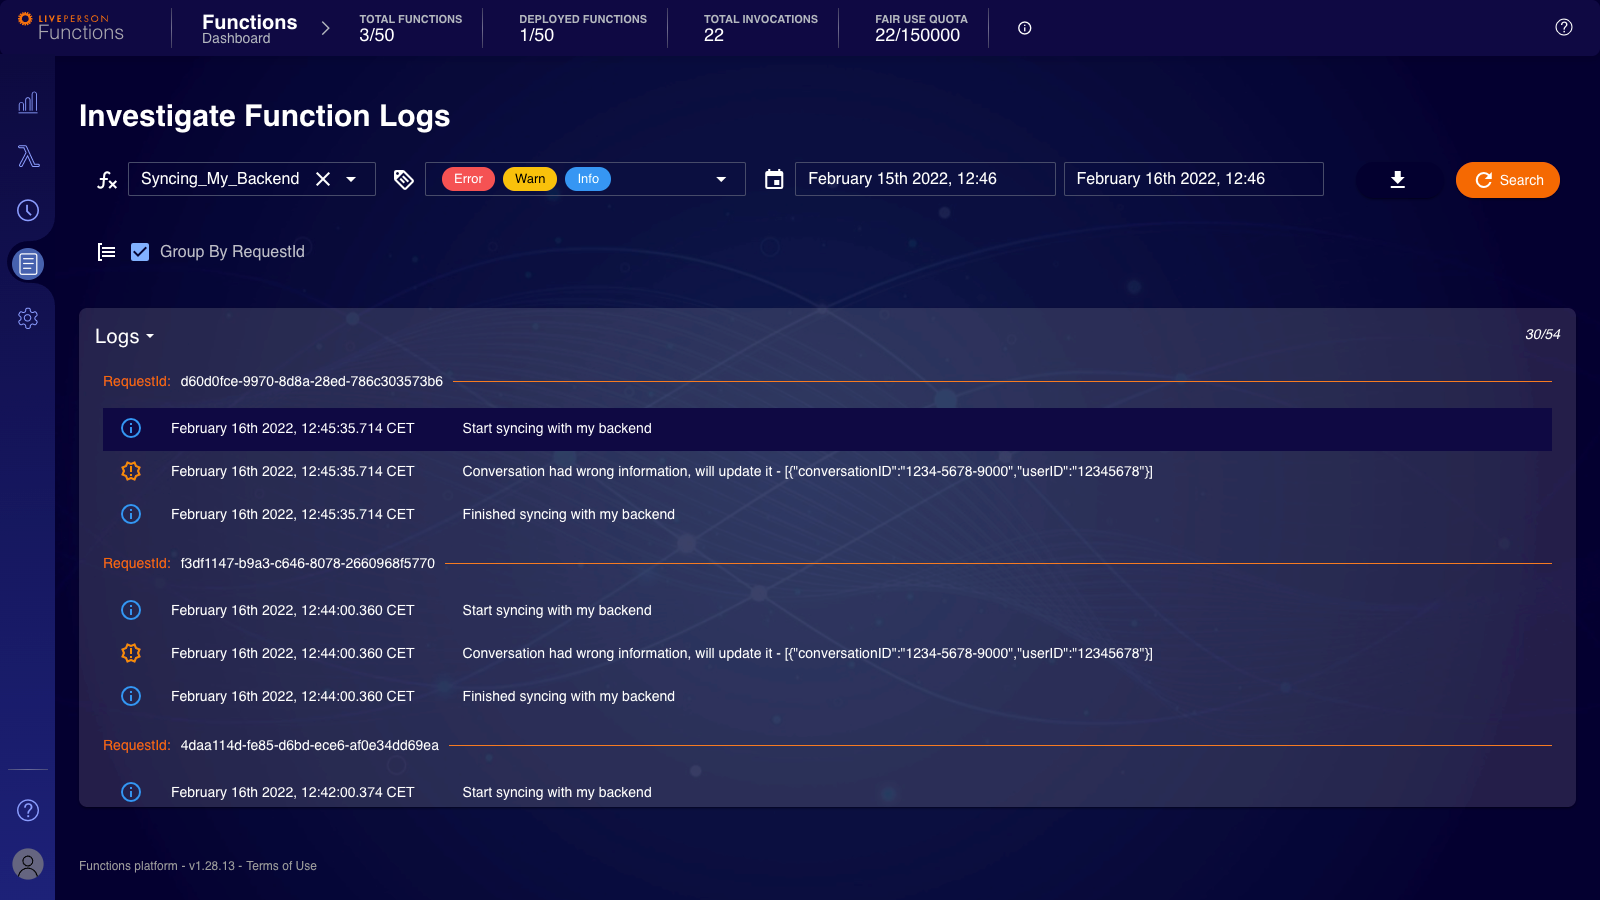
You may tick the "Group By RequestID"-box, which will batch all logs belonging to a specific invocation, ensuring you will not mix up logs belonging to different requests.
You can download the logs as a CSV export of your current view by clicking the "Download"-button. Please be aware that we only allow up to 500 log lines to be exported based on your time window and log quantity. You may not download all available logs. In this case, we suggest adjusting the time window to smaller chunks. The CSV export has the following structure:
lambdaUUID;requestID;timestamp;level;message;extras
6f91f192-c1df-40e0-94f9-8765fd70fd02;d60d0fce-9970-8d8a-28ed-786c303573b6;Wed, 16 Feb 2022 11:45:35 GMT;Info;Start syncing with my backend;[]
6f91f192-c1df-40e0-94f9-8765fd70fd02;d60d0fce-9970-8d8a-28ed-786c303573b6;Wed, 16 Feb 2022 11:45:35 GMT;Warn;Conversation had wrong information, will update it;"[{""conversationID"":""1234-5678-9000"",""userID"":""12345678""}]"
6f91f192-c1df-40e0-94f9-8765fd70fd02;d60d0fce-9970-8d8a-28ed-786c303573b6;Wed, 16 Feb 2022 11:45:35 GMT;Info;Finished syncing with my backend;[]
Limitations
Please consider the following limitation that is in place for our current logging system.
- Logs are pushed directly from the function to our services, meaning if a function is crashing or timing out, logs may be lost
- Debug logs are never persisted and only displayed while performing test invocations
- We will allow only 10 entries per invocation. Only the first 10 logs will be available
- A single log combining
message+extramay not exceed 6000 characters - All logs (combining
message+extra) together may not exceed 6000 characters - Logs may take up to 3 minutes to be available after invocation
- Only a maximum of 10000 logs can be found during a search
Activities
Given that multiple developers and users may use a Functions account, it can get hard to keep track of changes and identify users who may have caused issues. To tackle this challenge, we offer our activity stream. This stream is visible on the "Home"-Page. The displayed data consists of 4 information:
- Date
- User
- Activity
- Description
All activities will be stored for roughly two months and can be reviewed in this time window. For example, some of the activities, Lambda Update, come with different subactivities. The Description field usually discloses those. Sticking to our example of the Lambda Update, you may see Lambda deployed and Code changed as potential subactivities.
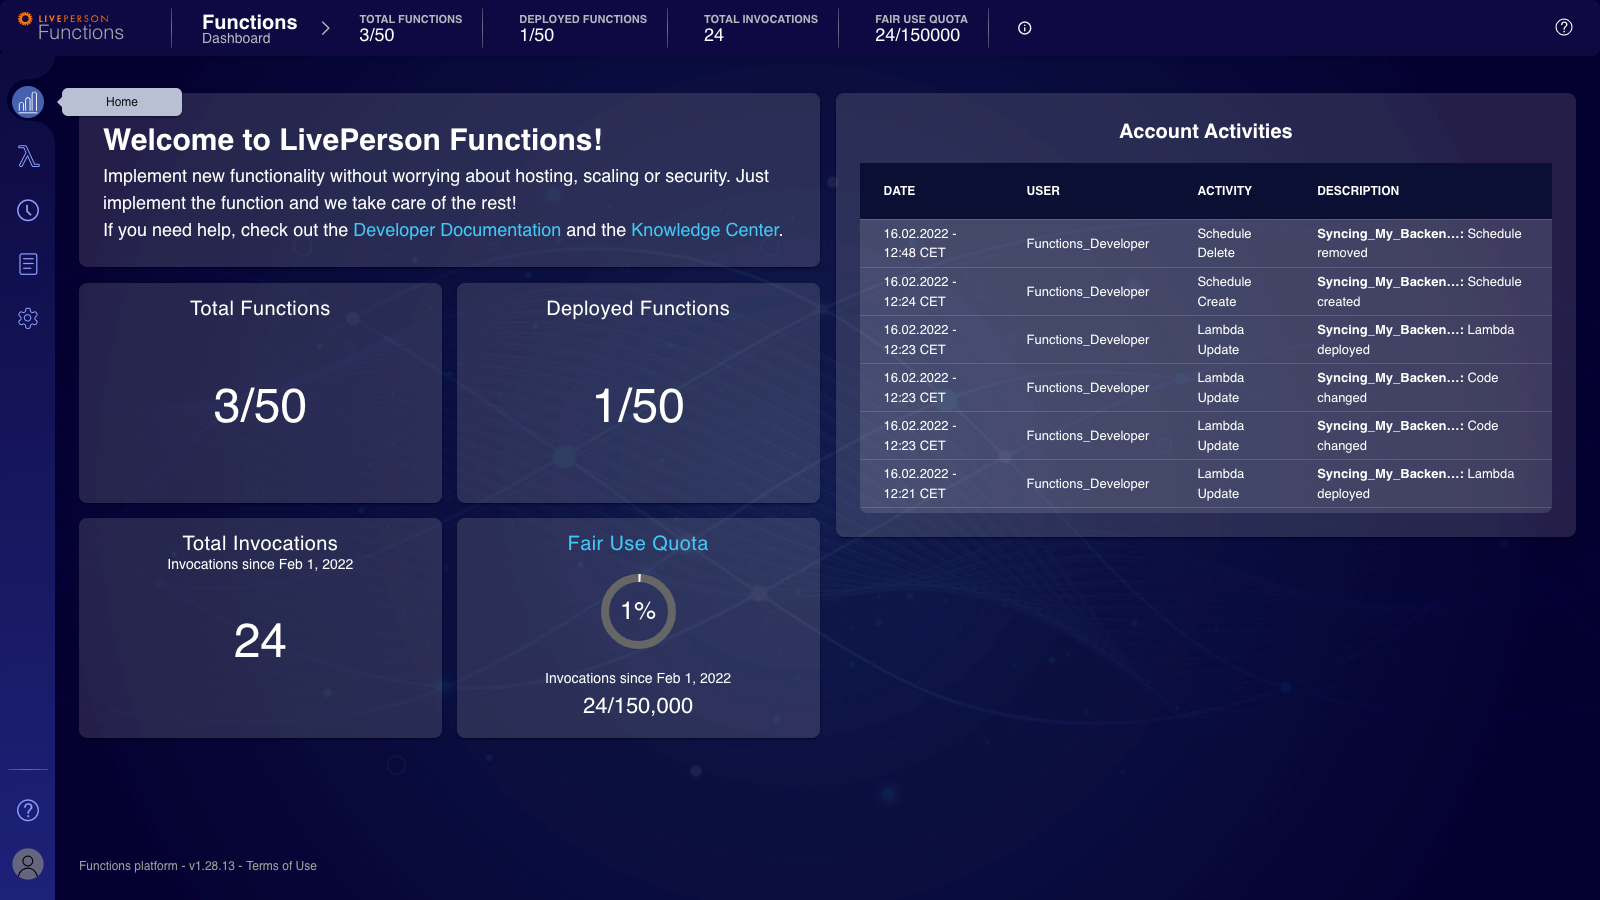
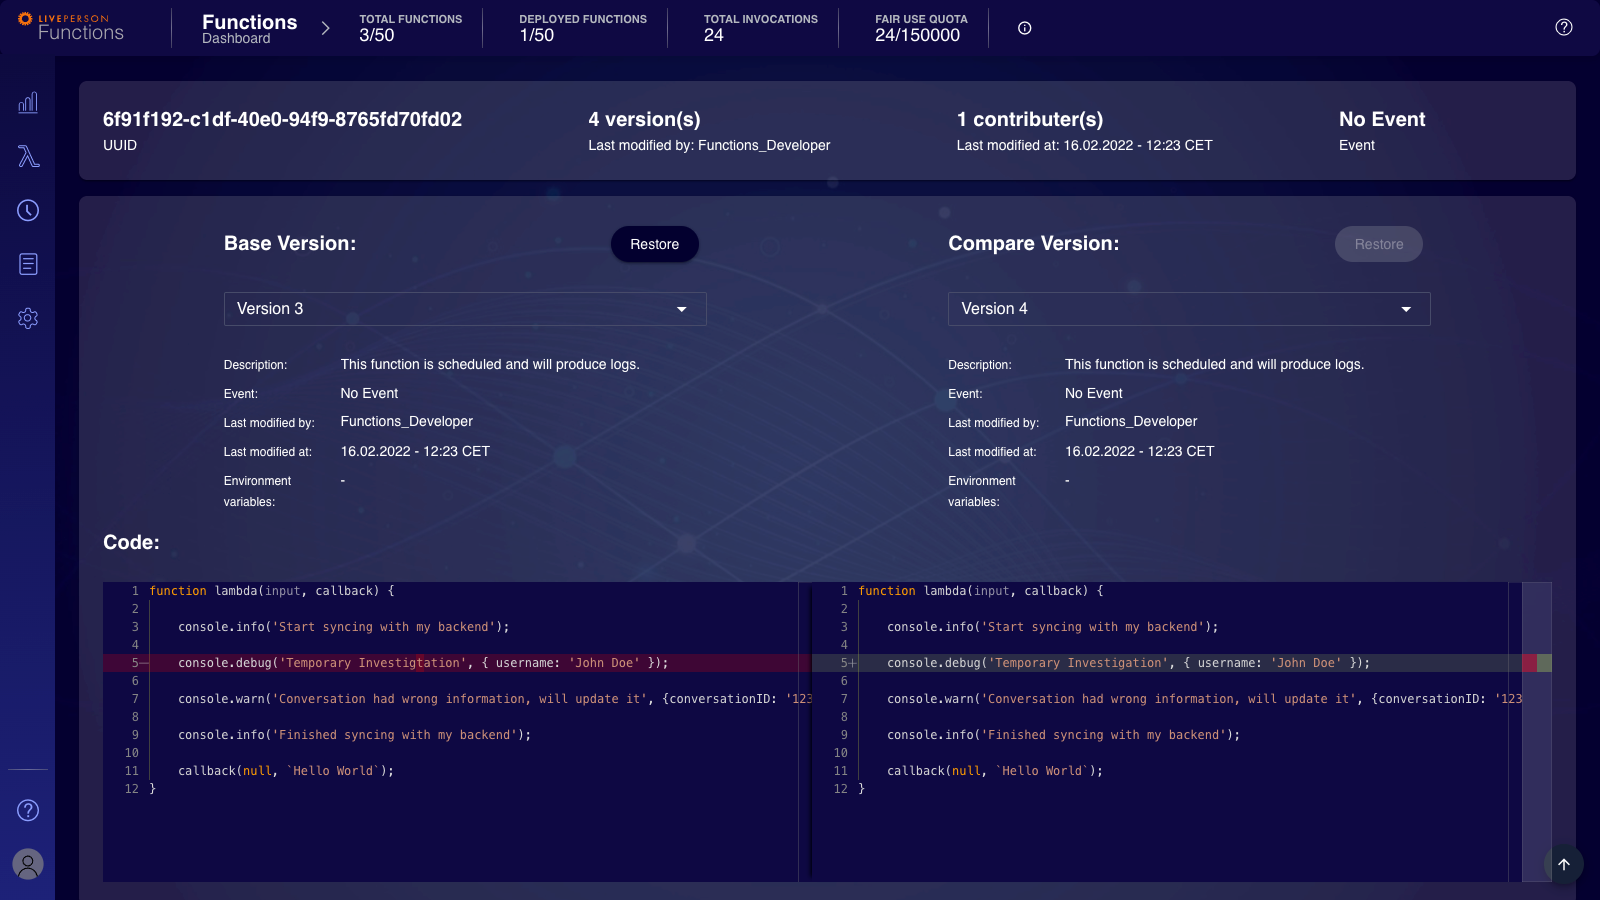
Clicking on an individual activity within the activity stream will bring you to a page based on the content. For example, a Code changed activity will bring you to a page comparing the previous and that versions. Things like changes to the allowlisting will get you to the allowlist settings.
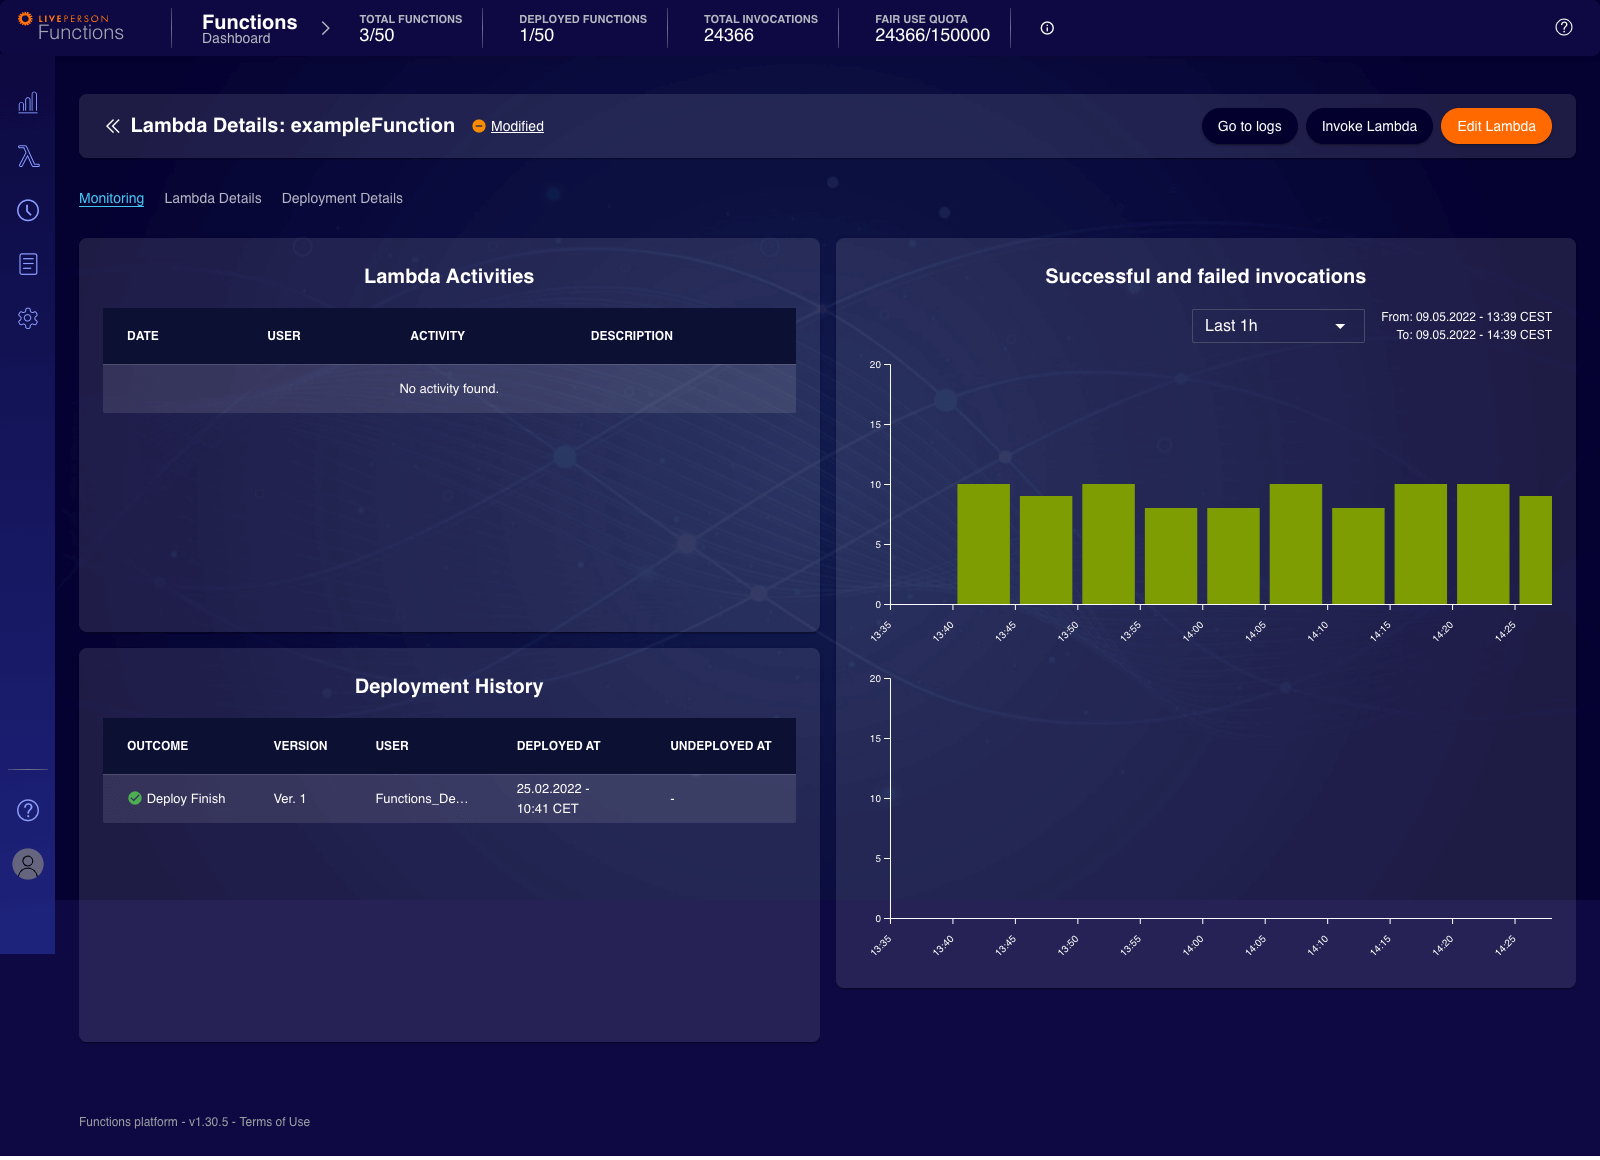
Invocation Histogram
The invocation histogram allows you to better understand how your function was invoked over time and how it behaved. The graph includes successful and unsuccessful invocations.
Please be aware that invocation data will be retained for the last 30 days and not longer. The graph is updated every few minutes.
The invocation histogram is accessible via the details page of a function. You may only choose the following values for the time window 1h, 24h, 7d or 30d. Please note that the x-axis will adjust based on the chosen time window. In the displayed example the chosen time is 1h.
Alerting
The LivePerson Function Alerting feature is currently in early access. It provides best-effort alerts based on your alert configuration and improves visibility into the platform.
The Alerting feature allows brands to configure alerts for their function based on the number of function errors or other values like the average response time. Configured alerts will be evaluated and triggered if a configured threshold is crossed, and the Functions Alerting feature will send an email to predefined recipients. For example, a brand can configure an alert that will be triggered if the amount of their function timeout errors exceeds a specific value.
You can configure Functions Alerts via the alerting tab by clicking "Create alert".
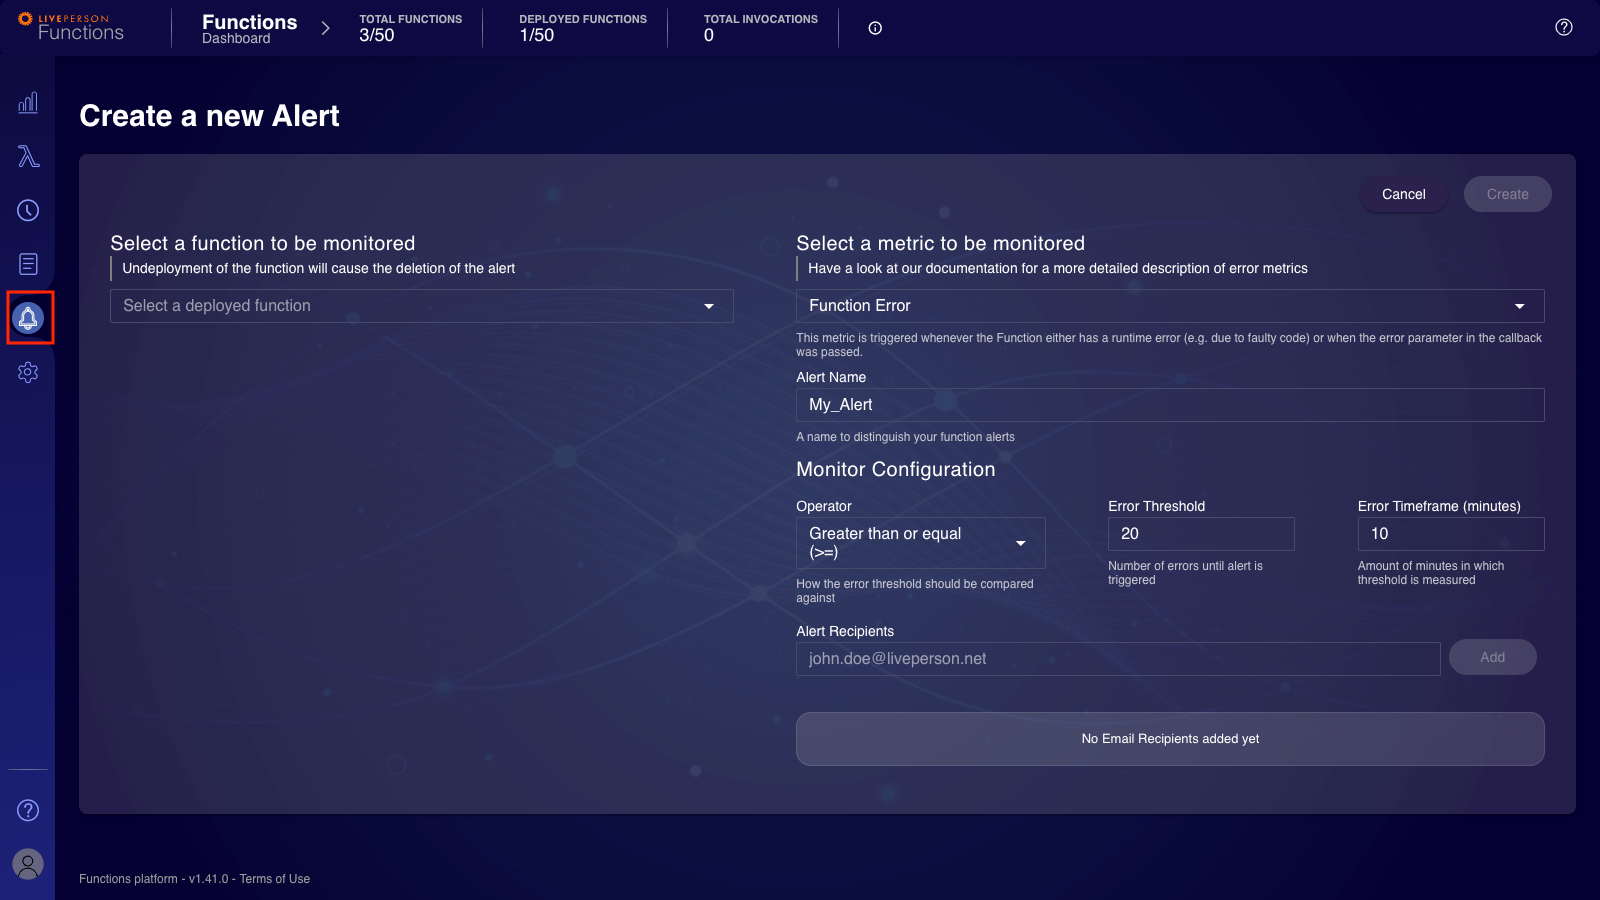
Alert Configuration properties
| Property | description | type |
|---|---|---|
| Alert name | Name of the alert | String |
| Alert type (metric) | The type of the metric to be evaluated | Function Error, Function Timeout Error, Function Response Delayed Error |
| Operator | Used to compare the "errors threshold" during the evaluation process | ==, >, >=, <, <= |
| Error threshold | Specific value that will be compared to the number of errors (or other value) using an "operator" during the evaluation process | number between 1 - 999. A number between 1 - 30 for Function Response Delayed Error |
| Error time-frame (minutes) | time-window in which the metrics are considered | Number between 10 - 60 (minutes) |
| Alert recipients | Will receive an email when an alert is triggered | List of emails |
Types of Alert Configurations
Be aware that the returned invocation status code for timeout and function error is the same (901).
| Alert type (metric) | description |
|---|---|
| Function error | Considers the number of failed invocations where the function code returned an error response. This does not include timeout errors |
| Function timeout errors | Considers number of function timeout errors |
| Lambda delayed response | Considers the average response time of successful invocations. Since the max running time is 30 seconds, functions taking longer are considered timeout errors and won't be considered for this metric |
Evaluation
Configured alerts will be evaluated periodically based on their specific configuration. For example, an alert will be triggered when the evaluation process detects that the amount of errors is greater than a configured threshold in the last X minutes (time frame).
Each time an alert is triggered, the predefined recipients will receive an email.
If there are no values to evaluate (no invocations) or the number of errors is 0, evaluation won't consider an alert to be fired (for example, an alert configured to be triggered when the amount of errors is less than a specific value won't be fired there are no errors)
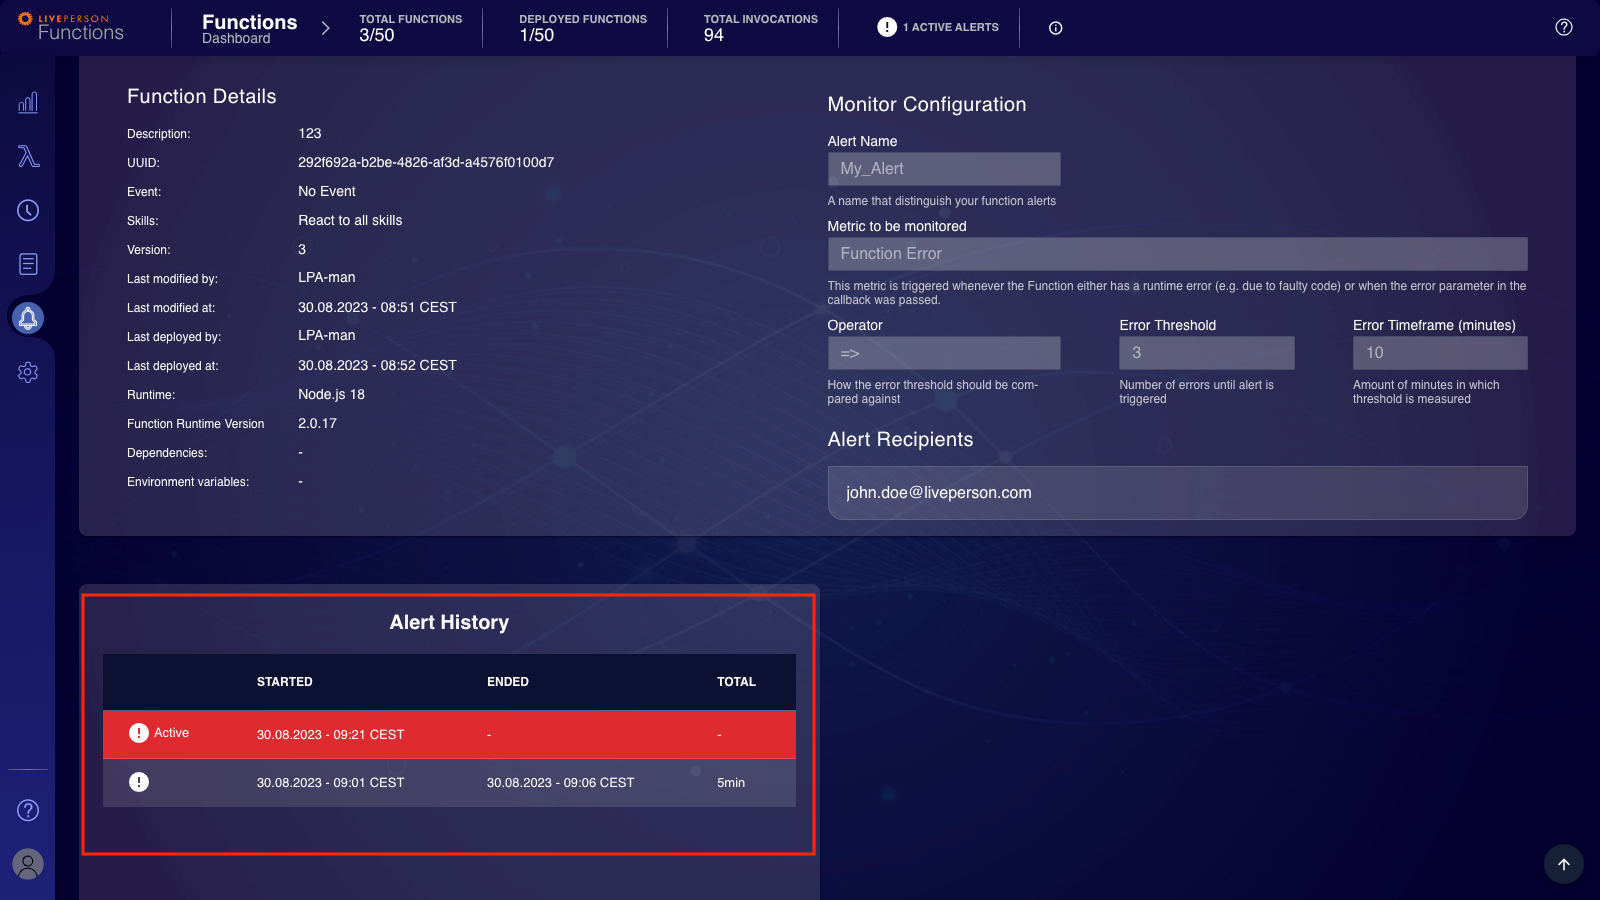
Alert History
You can find the triggered alerts history on the alerting tab by clicking a configured alert name.
Limitations
- Only a maximum of 3 alert configurations per function are allowed.
- Up to 50 alerts in total.