
The LivePerson Functions Logging feature provides visibility into the execution of your functions. By accessing the logs, developers can debug issues, monitor execution flows, and verify that their logic is performing as expected.
Overview
Every time a function is invoked, standard output (stdout) and standard error (stderr) are captured by the platform. These logs are then made available in the LivePerson Functions dashboard, allowing you to trace the lifecycle of an invocation.
Writing Logs
To write to the logs, use the standard logging interface available in your runtime environment. In Node.js, the console object is integrated with the platform's logger.
The logging interface supports the following methods:
-
info(andlog): Maps to the Info level. Use this for general information, successful milestones, and operational status.console.info("Function started for user", userId); console.log("Processing complete"); -
warn: Maps to the Warning level. Use this for non-critical issues, deprecated usage, or expected anomalies that do not halt execution.console.warn("API response time was slower than expected"); -
error: Maps to the Error level. Use this for exceptions, critical failures, or logic errors that require attention.console.error("Failed to connect to third-party service", errorObject); -
debug: Maps to the Debug level. Debug logs are not produced during standard production invocations. They are generally only visible during test invocations or specific debugging sessions.console.debug("Detailed payload dump:", fullPayload);
Only these methods (debug, info, log, warn, error) are supported for user logging. If you use any other method it will cause a runtime crash.
Logging Constraints
To ensure platform stability and performance, the logging system enforces specific limits per function invocation:
- Maximum Log Entries: 10 log entries per invocation.
- Maximum Total Log Size: 16,384 characters (combined across all lines) per invocation.
If an invocation exceeds these limits, the platform will stop writing further logs for that execution and inject a system warning indicating that the limit was reached. This does not affect the actual execution or outcome of your function, only the visibility of subsequent logs.
Serialization & Sanitization
-
Error Objects: The logger attempts to safely serialize
Errorobjects, preserving properties like the stack trace (where applicable) for better debugging. - Sanitization: The platform includes a sanitizer that attempts to redact sensitive secrets from your logs before they are stored.
The sanitization process is performed on a best-effort basis. It is not 100% foolproof and should not be relied upon as the primary method for protecting sensitive data. Always be vigilant and avoid logging secrets explicitly.
Accessing Logs (Investigate Function Logs)
You can view and analyze logs in the Investigate Function Logs dashboard.
- Navigate to the Functions overview.
- Select the specific function you wish to inspect.
- Click on the Logs tab.
Dashboard Features
The logging dashboard provides a powerful interface to filter and analyze your data:
-
Filters:
- Function: Select the function you want to view.
- Log Levels: Filter by Info, Warning, or Error.
-
Time Range: Select a Start Date and End Date.
- Note: Logs can only be searched within a 2-week time window.
-
Grouping:
-
Group By RequestId: Toggle this option to group log entries by their unique invocation ID (
RequestId). This is extremely useful for seeing the full trace of a single execution in one block.
-
Group By RequestId: Toggle this option to group log entries by their unique invocation ID (
-
Search:
- Click the Search button to apply your filters and retrieve logs.
-
Export:
- Click the Download button (icon) to export the currently filtered logs to a CSV file.
- Limit: Due to size restrictions, exports are limited to the latest 500 log entries matching your criteria.
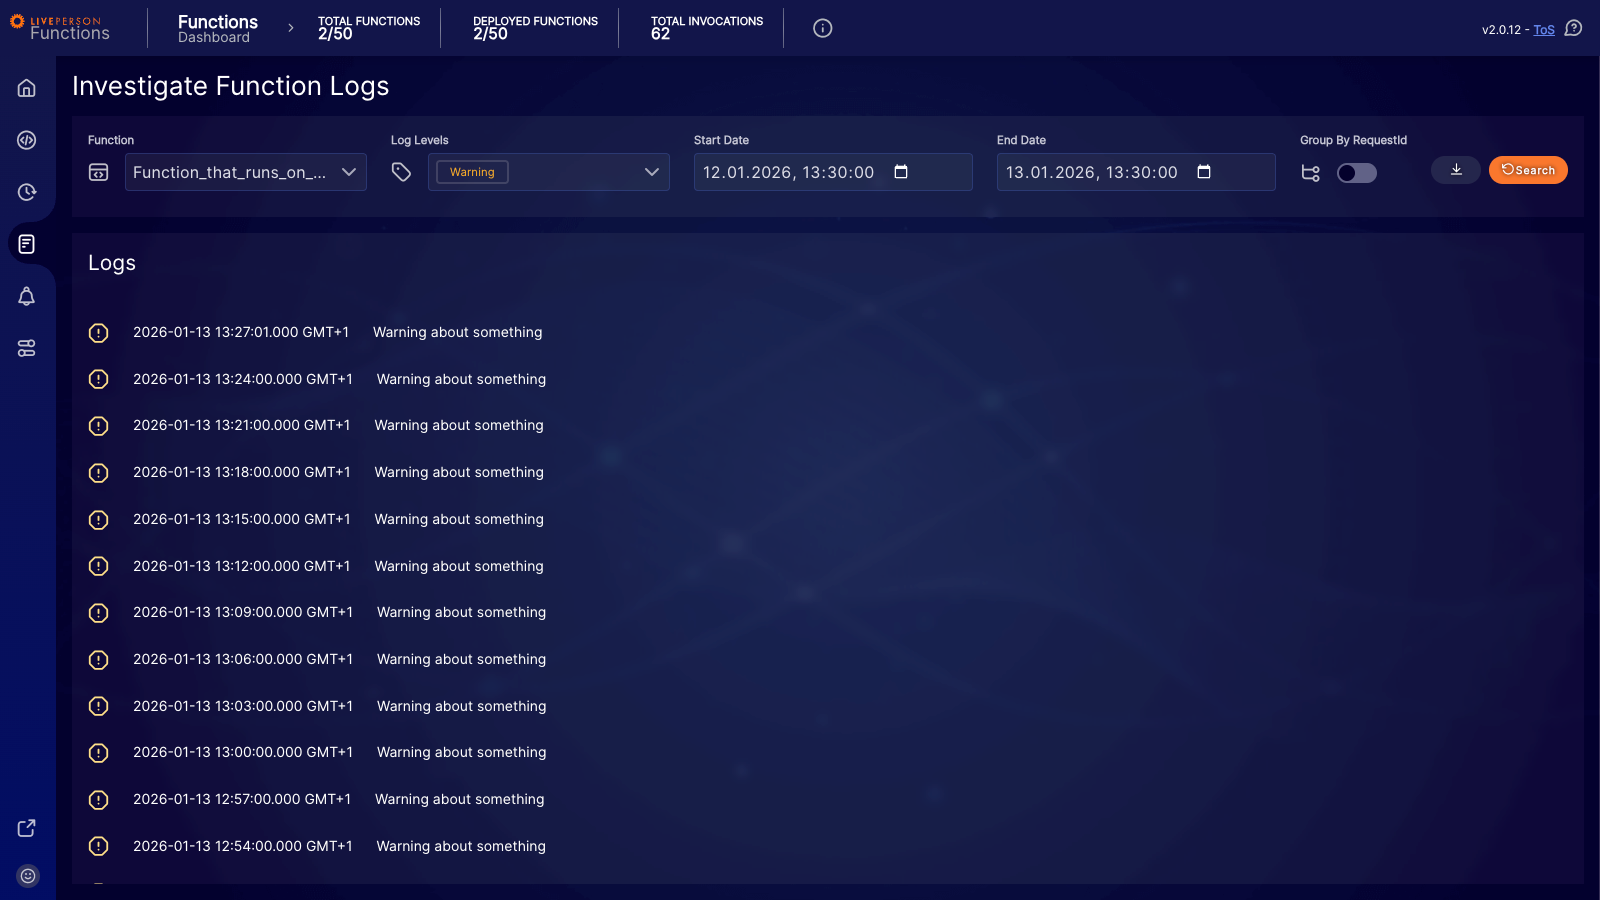 Figure 1: Log view filtered by 'Warning' level.
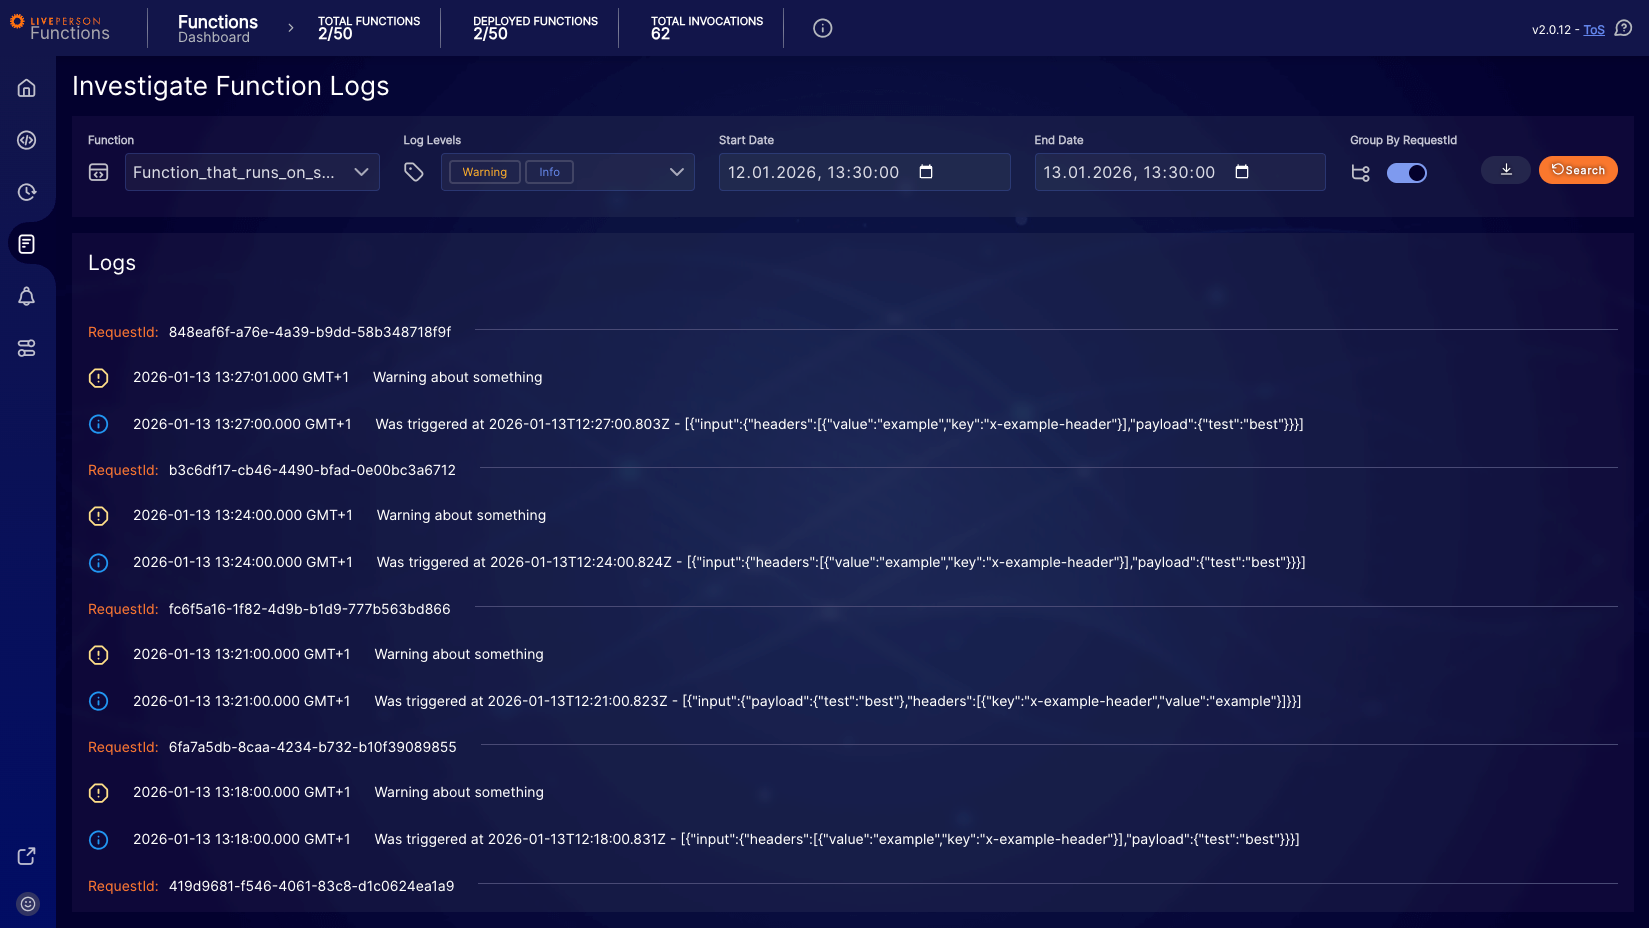 Figure 2: Logs grouped by RequestId, showing related entries for specific invocations.
CSV Export Example
When you export your logs, the CSV file will follow this structure:
FunctionUUID;requestID;timestamp;level;message;extras
d5ef73e1-38f0-48e8-9d45-79f65eb1625a;ded29309-0c9b-4461-a8a8-47669febc3f1;Tue, 13 Jan 2026 10:39:00 GMT;Error;Erroring now;[]
d5ef73e1-38f0-48e8-9d45-79f65eb1625a;ded29309-0c9b-4461-a8a8-47669febc3f1;Tue, 13 Jan 2026 10:39:00 GMT;Warning;Warning about something;[]
d5ef73e1-38f0-48e8-9d45-79f65eb1625a;ded29309-0c9b-4461-a8a8-47669febc3f1;Tue, 13 Jan 2026 10:39:00 GMT;Info;Was triggered at 2026-01-13T10:39:00.842Z;[{"input":{"payload":{"test":"best"},"headers":[{"value":"example","key":"x-example-header"}]}}]
d5ef73e1-38f0-48e8-9d45-79f65eb1625a;bb7eedde-5934-4d65-98f6-dfd05d0f4646;Tue, 13 Jan 2026 10:36:00 GMT;Error;Erroring now;[]
d5ef73e1-38f0-48e8-9d45-79f65eb1625a;bb7eedde-5934-4d65-98f6-dfd05d0f4646;Tue, 13 Jan 2026 10:36:00 GMT;Warning;Warning about something;[]
d5ef73e1-38f0-48e8-9d45-79f65eb1625a;bb7eedde-5934-4d65-98f6-dfd05d0f4646;Tue, 13 Jan 2026 10:36:00 GMT;Info;Was triggered at 2026-01-13T10:36:00.900Z;[{"input":{"payload":{"test":"best"},"headers":[{"key":"x-example-header","value":"example"}]}}]
d5ef73e1-38f0-48e8-9d45-79f65eb1625a;ce5fae04-7711-4a9e-9690-ba8bf8d80d83;Tue, 13 Jan 2026 10:33:00 GMT;Error;Erroring now;[]
Log Retention
- Retention Period: Logs are retained for 1 month.
- Search Window: You can only search for logs within a maximum window of 2 weeks at a time.
For long-term retention or audit compliance, it is recommended to export critical logs or rely on external logging integrations if available for your account tier.
For a comprehensive list of logging limits, please refer to the Limitations page.
Best Practices
To make the most of the logging facility while respecting limits:
- Structured Logging: Prefer logging JSON objects over plain strings. This makes it easier to parse and analyze logs later, especially when exporting.
console.info('Your Message', { action: "user_login", userId: "12345", status: "success" }); - Be Concise: Given the 10-line and 16k-character limits, avoid logging massive objects or verbose loops. Log only what is necessary to trace the execution state.
- Sanitize Data: Never log Personally Identifiable Information (PII), API keys, passwords, or authentication tokens. While the platform has some sanitization, it is your responsibility to ensure data privacy.
- Use Correct Levels:
- Use
errorfor exceptions that require attention. - Use
warnfor edge cases that handled gracefully but might indicate a problem. - Use
infofor high-level milestones (e.g., "Function started", "Processing complete"). - Avoid using
debugfor anything you need to see in production.
- Use
- Correlate Logs: The
RequestIdis automatically handled, but if you interact with external systems, consider logging their correlation IDs to trace requests across boundaries.